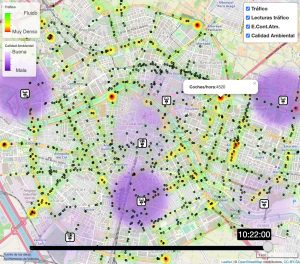
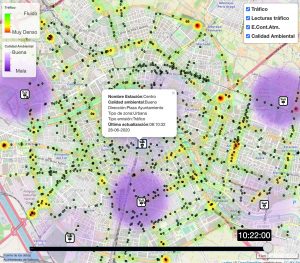
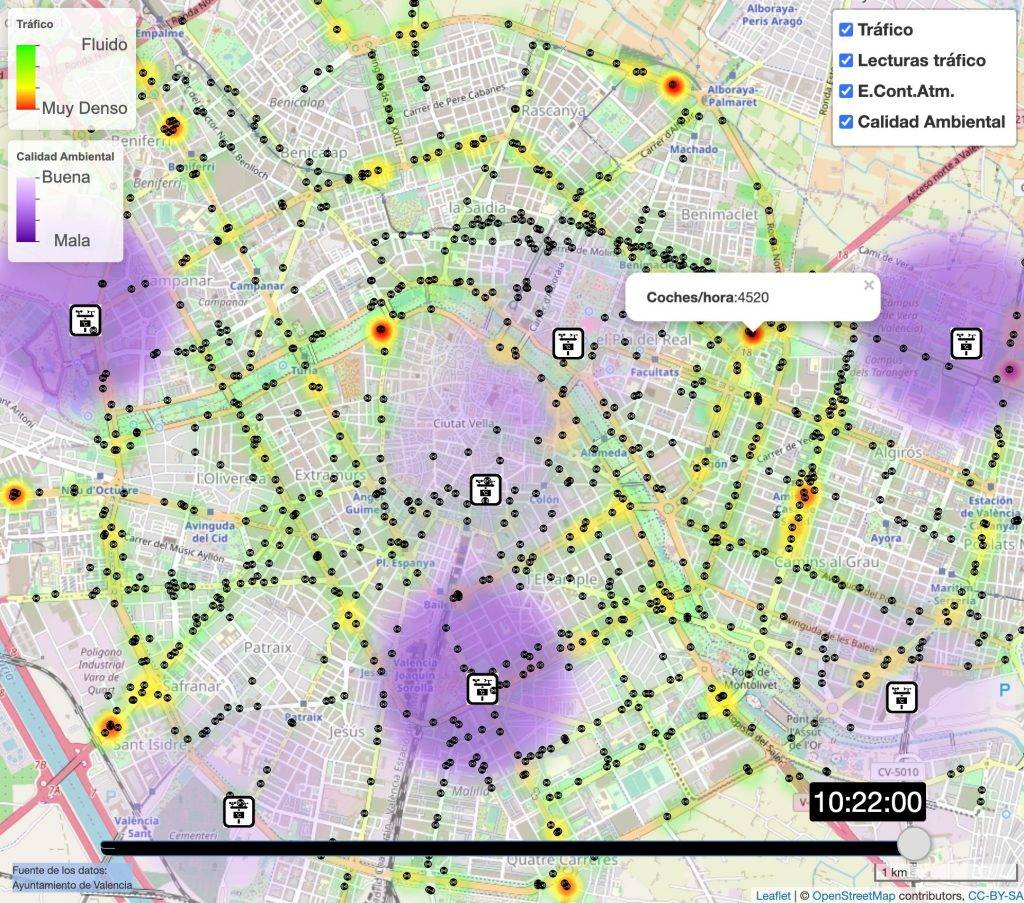
Real time traffic and pollution heat map of Valencia.
On this map you will see the traffic and pollution in Valencia in real time. Its design is simple and straightforward, easy to understand and has various applications. This project has been done using R and Python.
Visualize the traffic of Valencia in real time. It is also possible to visualize the environmental quality, provided by 7 air pollution stations located throughout Valencia.P
First of all, Traffic visualization: With this map you will be able to observe traffic trends. Also, allows to know which areas are denser and therefore, avoid them when driving or walking to avoid contamination.

Second, Contamination visualization: With this map you will be able to observe and analyze the environmental quality of Valencia in the 7 different measurement points(air pollution stations of Valencia).
Actually, pollution in cities is one of the problems of the 21st century. Thanks to this tool, citizens can become aware and take measures to reduce pollution.

Third, Real time: the map is updated every 3 minutes allowing to observe the traffic with an accuracy never seen before. This allows the user to know the exact traffic at each point in Valencia in real time.. Thus, we can get which routes are safer and less polluted to choose these in our itineraries.
Simplicity: The entire interface has been designed to remain simple and easy for everyone to understand.
Self explanatory: everything has been designed to be easily understood.
In conclusion, this heat map is an excellent tool. Lets see the traffic and pollution of all Valencia in the palm of your hand.
Studies carried out on pollution and traffic in Valencia during the period of confinement:
- POLLUTION AND TRAFFIC 2020 (LOCKDOWN) COMPARED TO 2017
- POLLUTION AND TRAFFIC CONFINEMENT, PHASE 0 AND PHASE 1


