
GFR performed by Andriana Ivashkiv: https://www.linkedin.com/in/kateryna-andriana-ivashkiv-shulhan-a833ba193/

INTRODUCTION
The growing concern about different political causes, The economic and socio-cultural aspects of the crime phenomenon have led to the development of the "third level of interpretation" of Criminology; obtaining generalizable results on crime through statistics from official sources[1].
On the other hand, and with the evolution of technology, study methods have been developed that allow monitoring of information on a large scale. Digitized cartography and, more concretely, Geographic Information Systems (SIG) represent and locate crime databases on maps. Likewise, allow establishing a relationship between crime rates and other physical factors, geographic and social[2].
The combination of both methods, statistics and cartography, makes possible the identification of crime patterns that can predict future patterns. This has a very important purpose; the preparation of studies that provide information on the causes of crime so that preventive or repressive-preventive measures and laws are carried out[3].
Thus, the analysis and results obtained from "Analysis of crime in the autonomous communities of Spain"[4], a Final Degree Project based on the official statistics of the Ministry of the Interior of Spain and the National Institute of Statistics. The objectives it pursues are the following:
- Identify which are the autonomous communities of the country with a high index, medium and low crime.
- Analyze the criminal activity of the territories during 2017, 2018 and 2019, as well as during their trimesters.
- Find out which of the twelve selected criminal typologies have a higher or lower commission rate according to the autonomous community.
- Determine which of the twelve factors chosen are those that have a greater relationship with crime; the demographics, the economic ones, educational and / or social.
This work makes use of the same crime database as the virtual crime map in Spain (Ministry of Interior) (annex page. web). Thus, the map becomes a support and observation tool for the study of crime, as it allows to have a spatial orientation on the distribution of crime in Spain and enables the reader to interact with the information.
In this way, the analysis is divided into three sections. The first covers the study of the average of total crimes in Spain and the evolution of criminal activity over time.. The second section collects the analysis of twelve criminal typologies. Finally, In the third section, a study is carried out to find out the degree of relationship that exists between the number of crimes committed in 2017 and twelve other factors that may explain crime.
MAP EXPLANATION entredatos.es/mapa/crimen/espana/
The map has been made by Angel Langdon Villamayor[5]. This helps to identify at a glance the territories and quarters with the highest and lowest criminal activity, as well as some of the most and less common typologies.
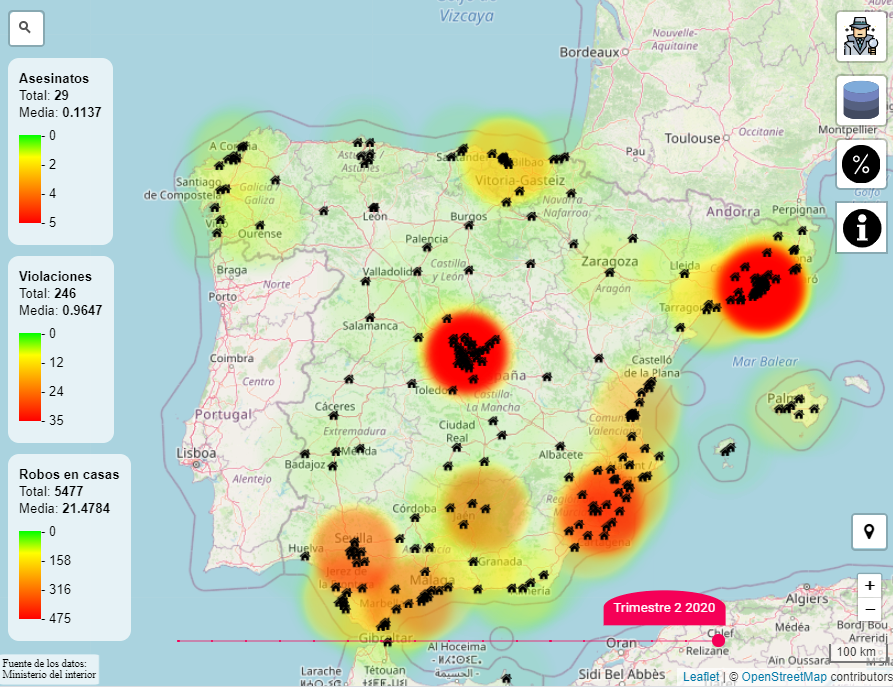
It has been carried out using official data both on total crimes in Spain and on some specific crimes; Intentional homicides and completed murders; intentional homicides and attempted murders; felony and less serious offenses of injury and riot; kidnappings; penetrative sexual assault; other crimes against sexual freedom and indemnity; robbery with violence and intimidation; burglaries at homes, establishments and other facilities; robberies with force only in homes; thefts; vehicle thefts and drug trafficking.
This tool offers the possibility of carrying out different functionalities. First, shows criminal activity divided into the four quarters of 2017, 2018, 2019 and the first two quarters of 2020, as well as the total annual crimes. Secondly, a search can be made according to the territorial organization of the country: autonomous communities, provinces and municipalities (collect the 244 most populated municipalities in Spain). You can also filter the number of crimes in absolute terms or for each 100.000 population, as well as seeing the incidence of a specific crime or of several of them.
As is typical of maps, It has a legend that helps to visually identify the areas with a higher or lower concentration of crime through colors. Likewise, this indicates the total and the average of crimes (both in absolute terms and for each 100.000 population). It is important to note that each quarter has a different legend because the number of crimes varies along the timeline.. The highest number of crimes in a territory in a quarter will be the maximum reference value, and the other figures that are close to this maximum value will be indicated in red. In the same way, the lowest number of crimes in a territory in a quarter will be the minimum reference value, and the other figures that are close to this minimum value will appear green or almost transparent. The rest of the territories will follow the corresponding colors indicated in the legend according to the number of crimes committed (Red, orange, yellow or green).
- Rodriguez Manzanera, L. (1979) "Criminology", Mexico: Editorial Porrúa. ↑
- Garrido, V.; Stangeland, P. and Redondo S. (1999). "Principles of Criminology" Valencia, Tirant lo Blanch and Vozmediano L. and San Juan C. (2010). "Environmental Criminology. Ecology of Crime and Security ". Barcelona: UOC Editorial. ↑
- Garrido et al. (1999) and Orellana Wiarco, THE. A. (2016). "Manual of Criminology". Mexico: Editorial Porrúa ↑
- Ivashkiv Shulhan, K. A. (2020) "Analysis of crime in the autonomous communities of Spain", University of Valencia, law School. ↑
- Data Science Student at the Polytechnic University of Valencia. ↑
Pingback: Virtual map and analysis of crime in Spain - Sec2Crime