
Pollution and vehicle hour levels during quarantine, phase 1 and phase 0
Introduction:
Contamination and confinement traffic, phase 0 and phase 1
A study of the evolution of traffic and pollution in Valencia will be carried out in the 3 different stages that the country has recently experienced: lockdown, phase 0 and phase 1 alarm status.
The following traffic and pollution data are available:
- Data according to different sections of Valencia from 27/04/2020 until the 3/05/2020 (Confinement period)
- Data according to different sections of Valencia from 04/05/2020 until the 10/05/2020 (Phase period 0)
- Data according to different sections of Valencia from 18/05/2020 until the 24/05/2020 (Phase period 1)
Is about 3 weeks, from Mondays to Sundays, in which each of them corresponds to one of the stages mentioned above.
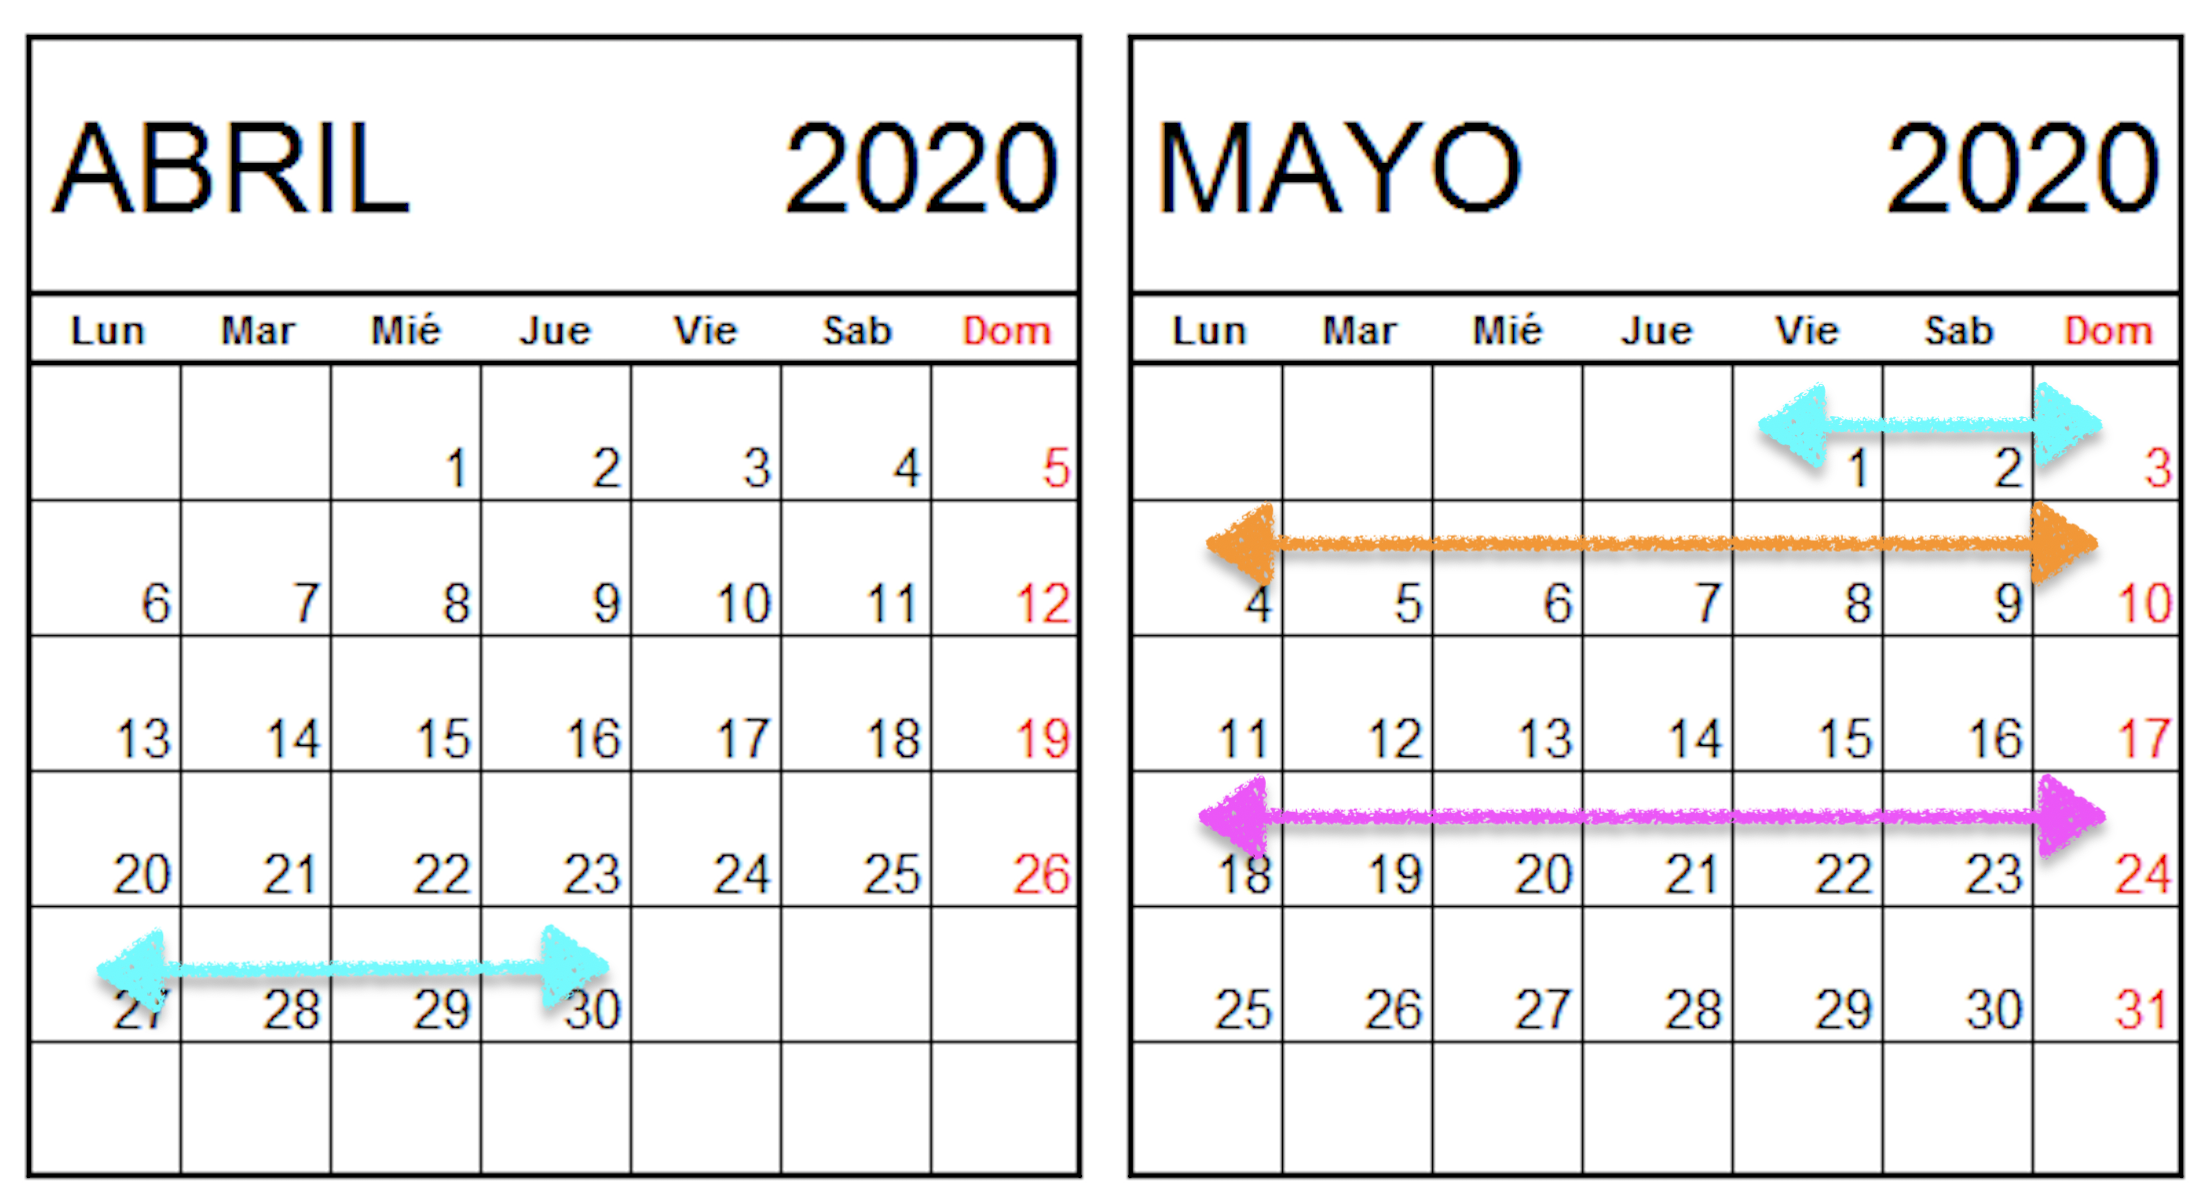
Figure 1.
1. Analysis and evolution of traffic and the contamination
-1.1 Average traffic during 7 days.
First of all, a small analysis will be carried out roughly, to observe how the traffic evolves in the three weeks that have been selected, comparing the different phases. In this case, a line graph will be shown in which the X axis represents the temporal axis (days) and, the y axis, the average number of cars passing a section in Valencia per day.
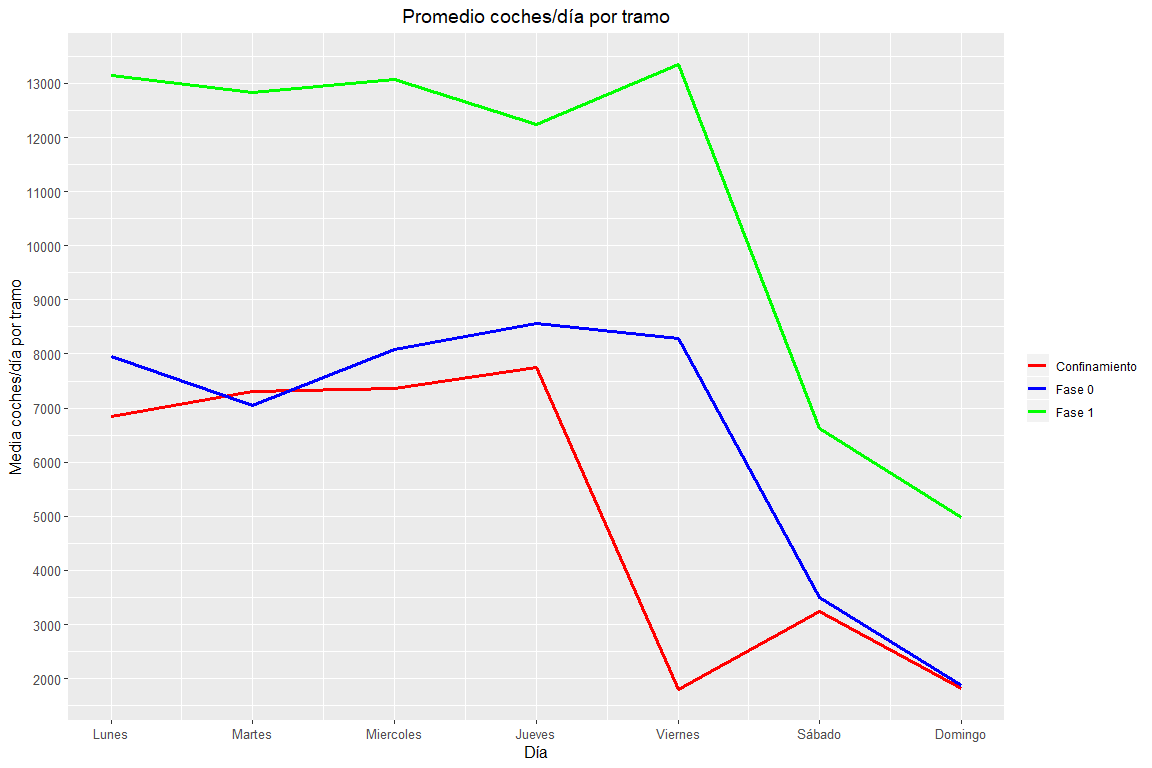
As expected, traffic volume has increased as less restrictive measures have been applied (de-escalated). It must be emphasized that there is little difference between the phase 0 and the state of strict confinement. Instead, there is a big difference between the phase 1 and the other phases. This must be because, in the phase 1, it begins to allow travel in vehicles within the province.
Then, the trend of pollutant levels in the two periods will be analyzed. Thus, you can see how the pollution has evolved, as the average number of cars circulating in Valencia has increased.
-1.2 Contamination levels of pollutants during 7 days:
Clarification: all measurements come from the average of all pollution stations
Evolution of pollution and traffic in confinement, phase 0 and phase 1 during 7 days.
-1.2.1 NO2 (Nitrogen dioxide)
NO2 is a polluting agent that is produced when Oxygen and Nitrogen meet at high temperatures. This process can occur in engines of internal combustion, lightning storms, acid rains, coal power plants, etc ... This pollutant can cause irritation to the lungs and, as a result of this, decrease resistance to respiratory infections.
The higher the NO2 levels the worse for human health.
Then, NO2 values will be displayed during the time period described above, of the three weeks:
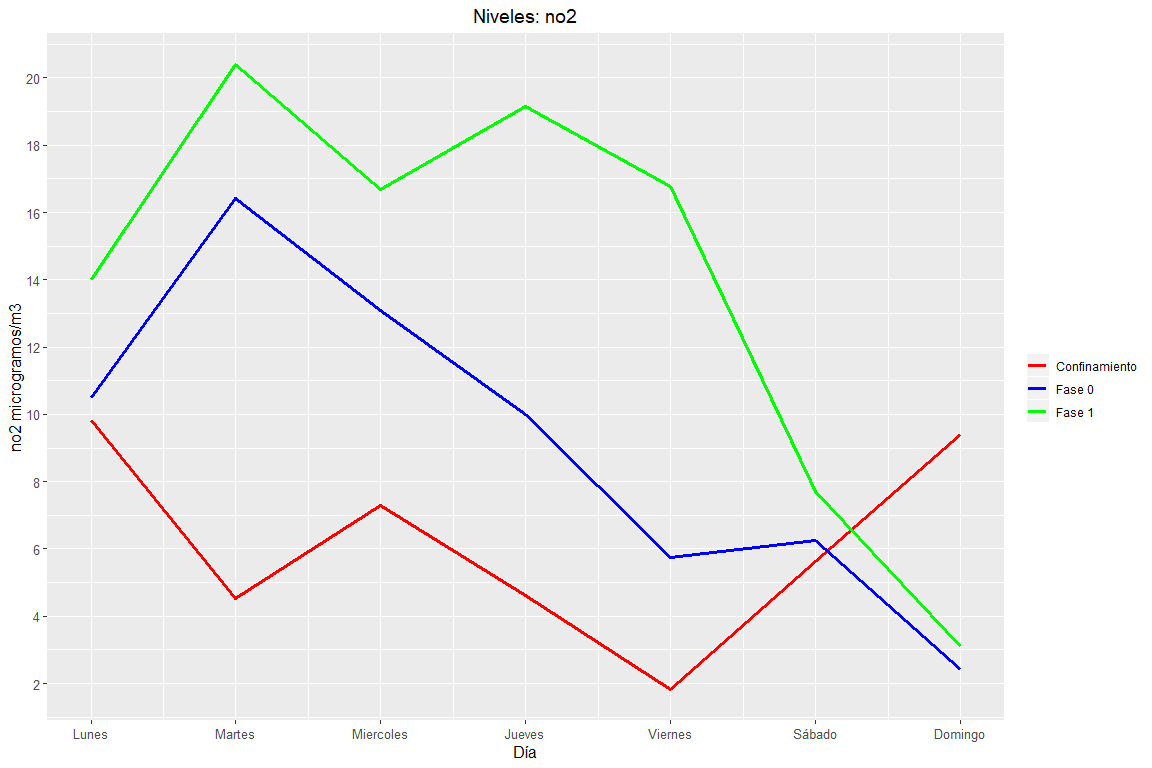
As can be seen in the graph, same thing happens in traffic, as the phases are less restrictive and the free movement of people is allowed more, so do levels of the NO2 pollutant
-1.2.2 PM10 (Suspended particles less than or equal to 10 microns per cubic meter)
PM10 is a contamination meter, Specifically, it determines the number of particles in suspension with a size less than or equal to 10 microns found in the environment. They are not a big health problem as long as they are larger than 2.5 microns since the body can expel them through the mucus or, do not reach the respiratory tree. These particles are created, mainly in combustion processes.
The higher the PM10 levels, worse for human health.
Then, PM10 values will be displayed for the time period described above, of the three weeks:
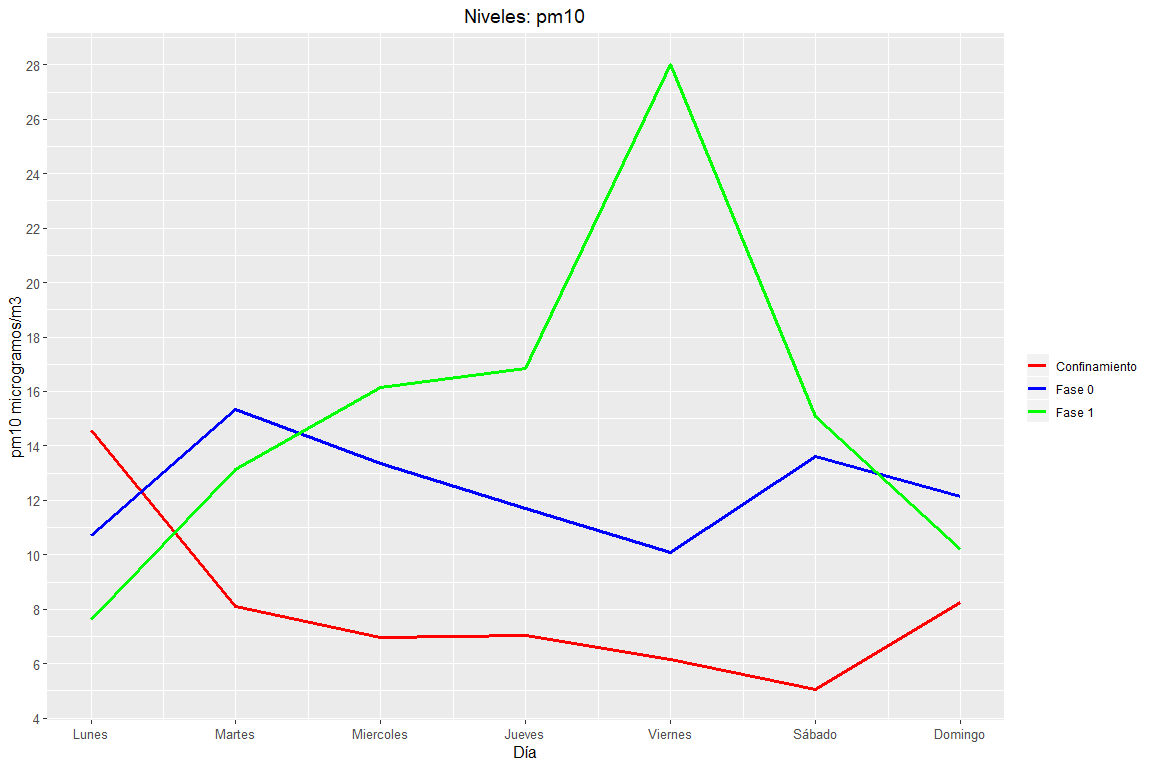
As can be seen in the graph above, mean PM10 levels increase as de-escalation occurs, that is to say, that the mean values in confinement are smaller than in the phase 0, and, at the same time, are smaller than in the phase 1. One of the possible reasons may be that, increased traffic and mobility activity, the more the environment moves, so, there will be an increase in the number of particles suspended in the air.
-1.2.3 PM2.5 (Suspended particles less than or equal to 2.5 microns per cubic meter)
PM2.5 is a contamination meter, Specifically, it determines the number of particles in suspension with a size less than or equal to 2.5 microns found in the environment. These pose a great problem since the body cannot expel them easily and they reach the respiratory tree thus causing respiratory diseases., allergies, etc ... These particles are created, mainly, in combustion processes.
The higher the PM2.5 levels, worse for human health.
Then, PM2.5 values will be displayed during the time period described above, of the three weeks:
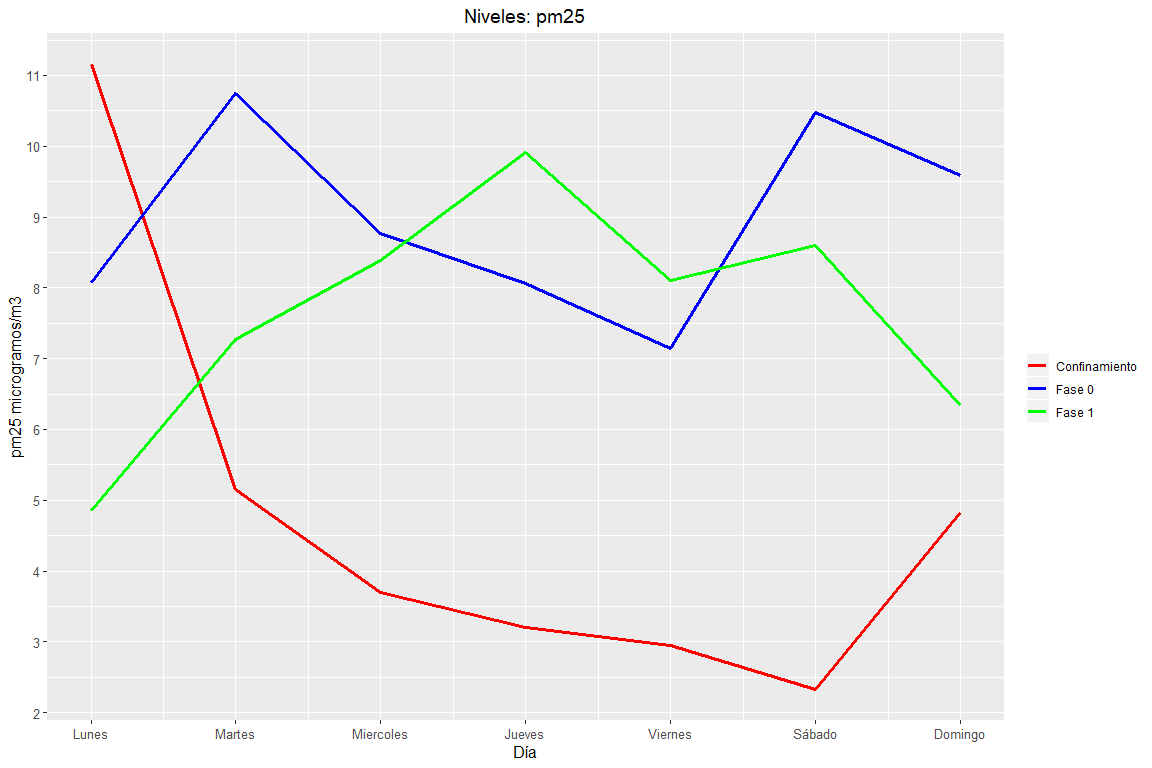
Regarding PM2.5, values increase dramatically during both phases, leaving the confinement stage with much smaller values. Instead, for the phase 0 and the phase 1, these particles follow a similar proportion in both weeks. It may be due to the same as with the PM10.
-1.2.4 SO2 (Sulfur dioxide)
SO2 is a colorless and irritating gas polluting the air. This is produced by the combustion of poorly refined fuels, in which there is a high presence of sulfur. So, Today's vehicles that use refined fuels are not causing a significant effect on SO2 levels.
The higher the SO2 levels, worse for human health.
Then, SO2 values will be displayed during the time period described above, of the three weeks:
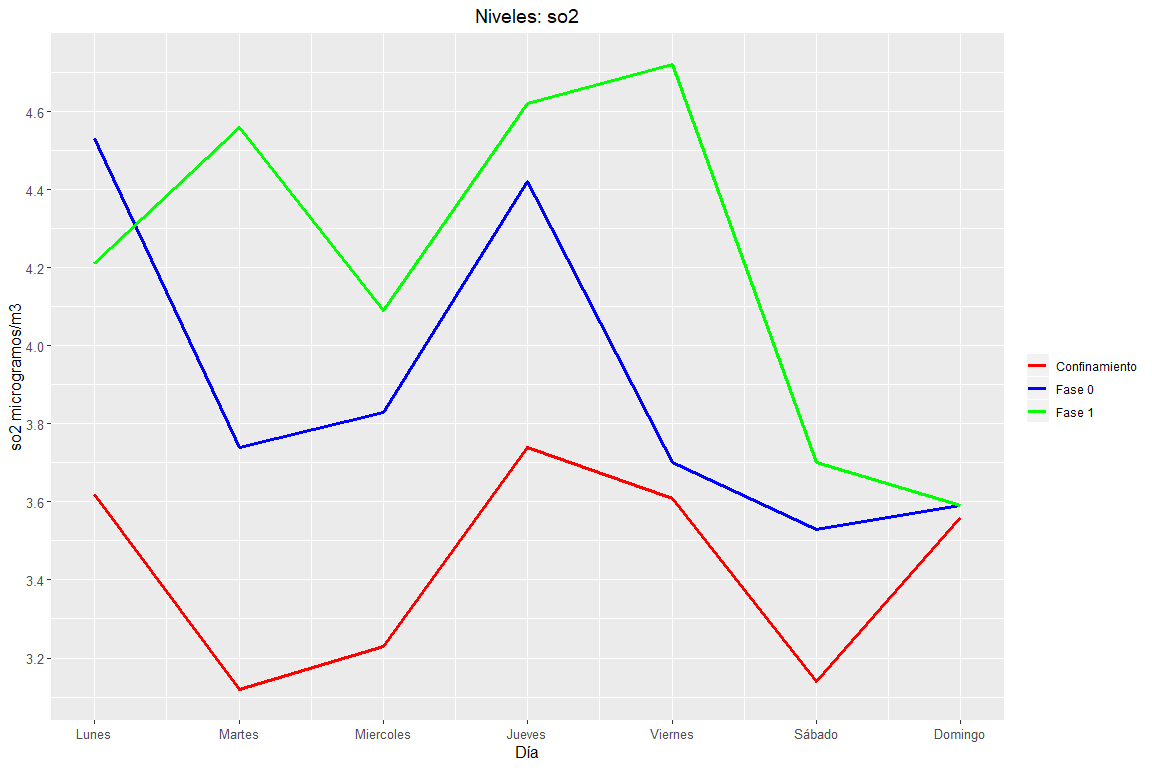
SO2 follows the same trend as the previous graphs, leaving the confinement stage with the smallest values. But this time, it is clearly seen how there are significant differences between the Phase 0 and the phase 1, obtaining in the most recent the highest values.
-1.2.5 O3 (Ozone)
Ozone is a colorless gas that is present in the air and can be harmful if its concentration is high and is maintained over time.. Causes respiratory diseases.
The higher the levels of O3 the worse for human health. But it must be emphasized that low concentrations of this gas do not produce any effect on health.
Then, O3 values will be displayed for the time period described above, of the three weeks:
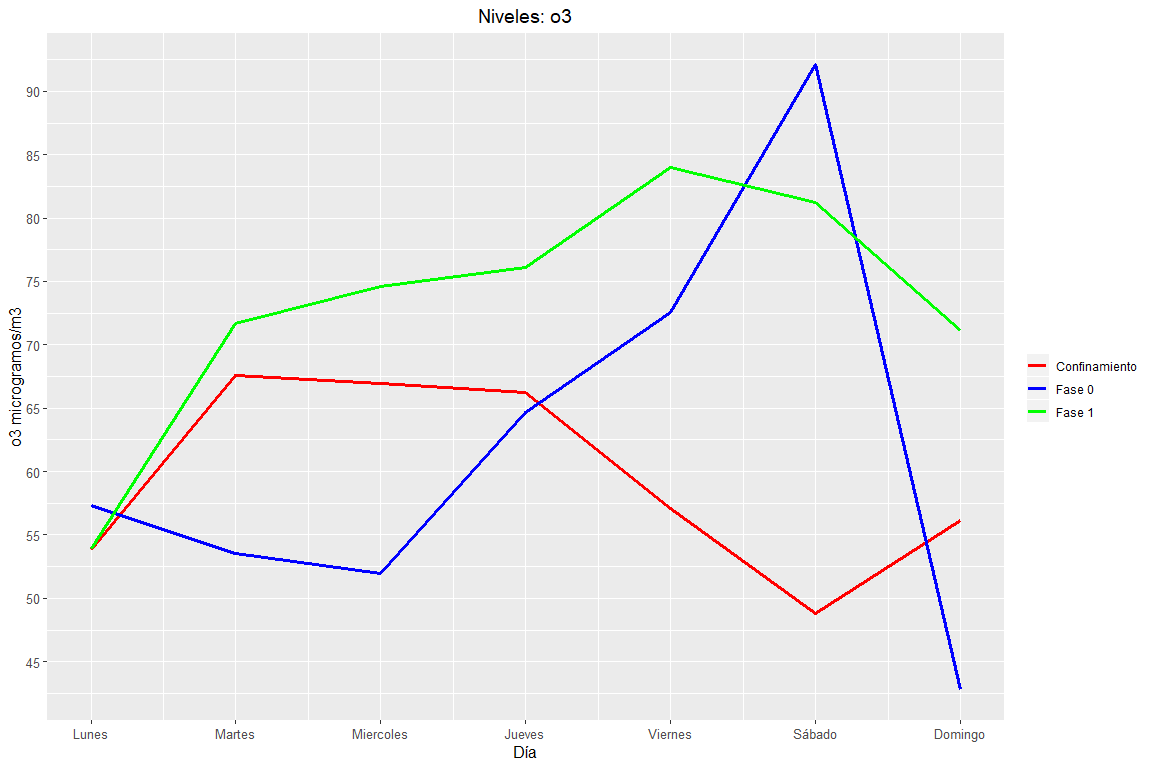
The phase 1 continues to be the one with the highest values, and the confinement stage the lowest. The phase 0 follows a somewhat strange and irregular trend due to unknown causes.
1.3 Traffic and pollution evolution on Wednesday of each week
Then, the evolution and pollution of traffic will be studied for one day, specific, during the Wednesday of each week of each phase.
Evolution of pollution and traffic in confinement, phase 0 and phase 1 every Wednesday.
1.3.1 Traffic
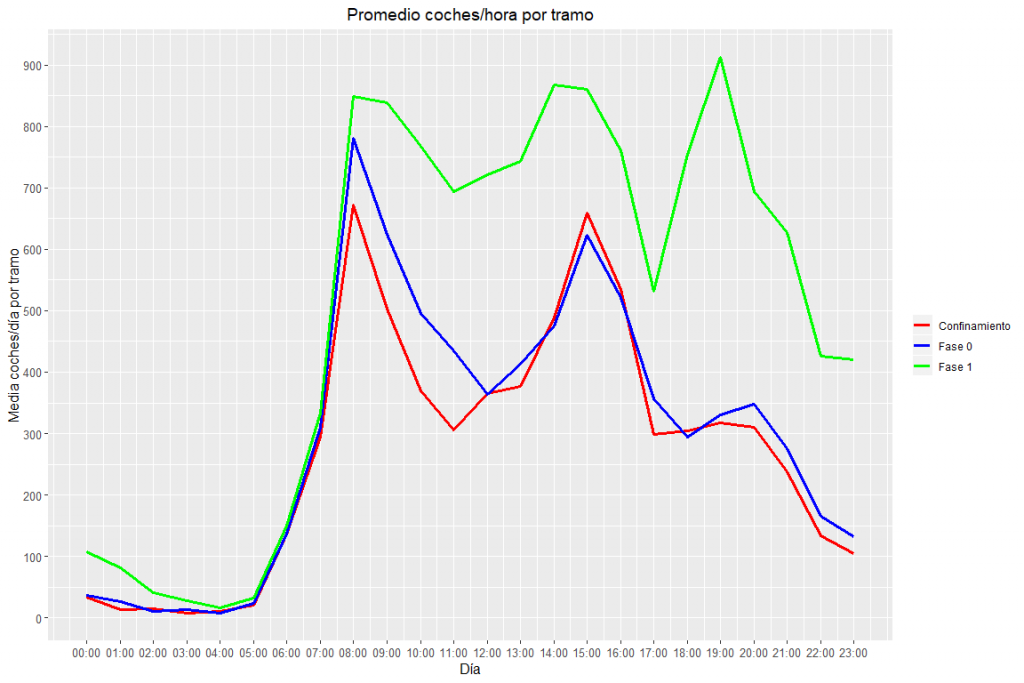
1.3.1.1 Line chart of average number of cars per section
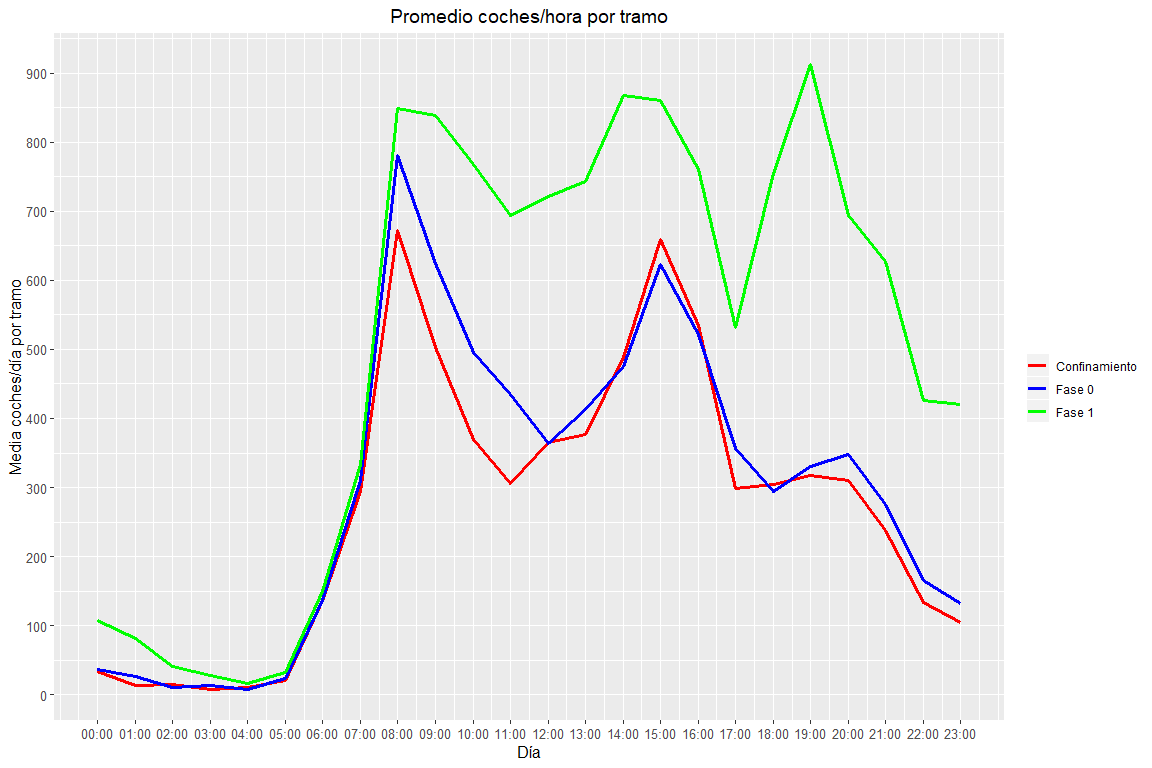
In this graph you can see how the average traffic during the first hours of a day, of 00:00 a 07:00, it is quite similar in all phases, except in the Phase 1, which as you can see is a little bit higher, this must be because entertainment venues may close later, therefore it will probably be people who are returning to their homes.
Too, you see how, as de-escalation happens, there is more traffic in the rush hour 08:00 when all the people go to work. This may be because, as the phases progress, so have the number of jobs allowed. Also you can see how the traffic in the Phase 1 remains superior to Phase traffic 0 and confinement. These last two phases follow a very similar trend, existing in the phase 0 higher vehicle hourly reading.
By last, you can see how from the 17:00 when they finish most full-time jobs they end, the number of cars circulating is much higher in the Phase 1 in which the other phases, this must be because in the phase 1 free movement of persons is allowed, as previously discussed.
Clarification: all measurements come from the average of all pollution stations
-1.3.2 Contamination
-1.3.2.1 NO2 (Nitrogen dioxide)
Then, NO2 values will be displayed during the time period described above, every Wednesday of every week:
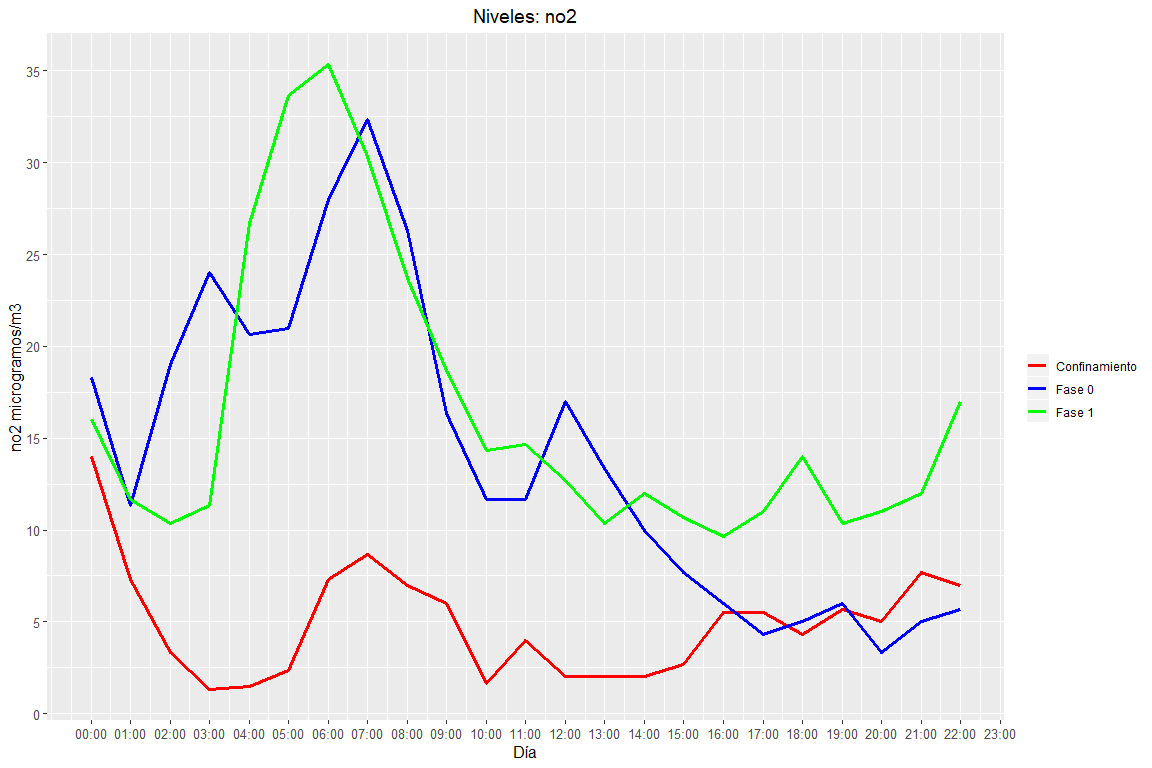
As can be seen in the graph, same thing happens in traffic, as the phases are less restrictive and the free movement of people is allowed more, so do levels of the NO2 pollutant
-1.3.2.2 PM10 (Suspended particles less than or equal to 10 microns per cubic meter)
Then, PM10 values will be displayed for the time period described above, every Wednesday of every week:
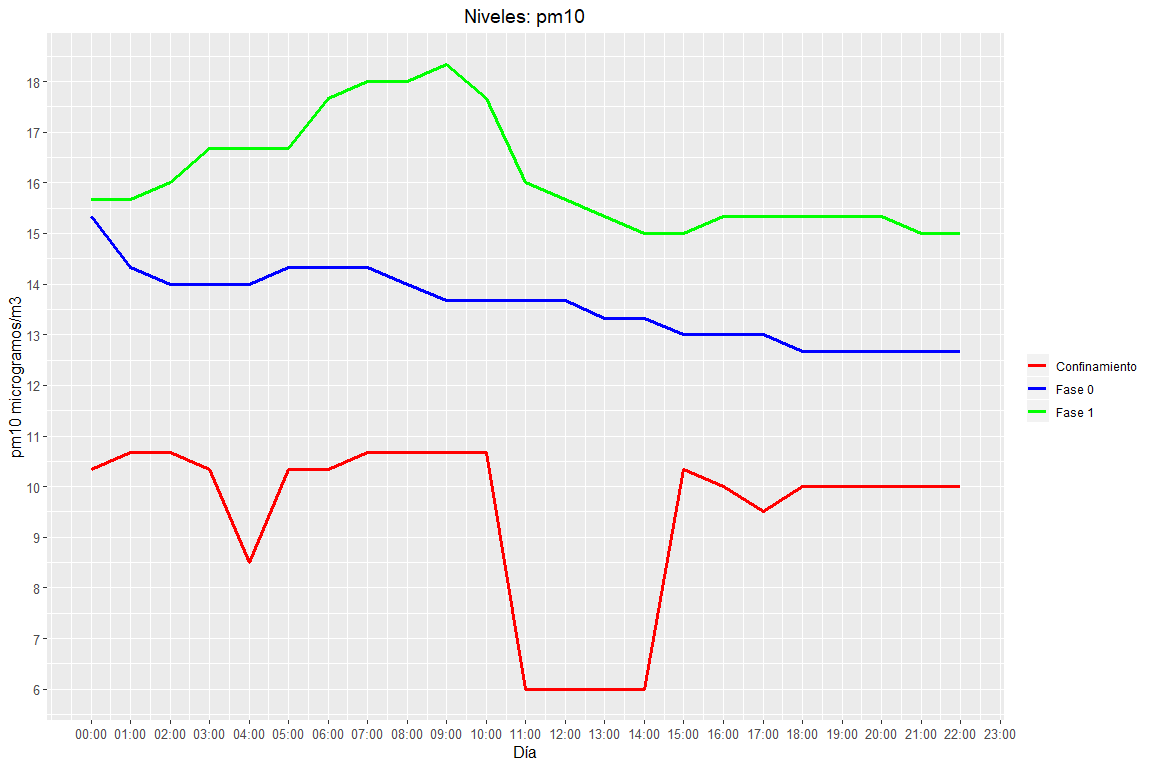
Regarding PM10 values, hourly, it is clearly observed that as de-escalation progresses there is an increase in these particles in the air.
-1.3.2.3 PM2.5 (Suspended particles less than or equal to 2.5 microns per cubic meter)
Then, PM2.5 values will be displayed during the time period described above, every Wednesday of every week:
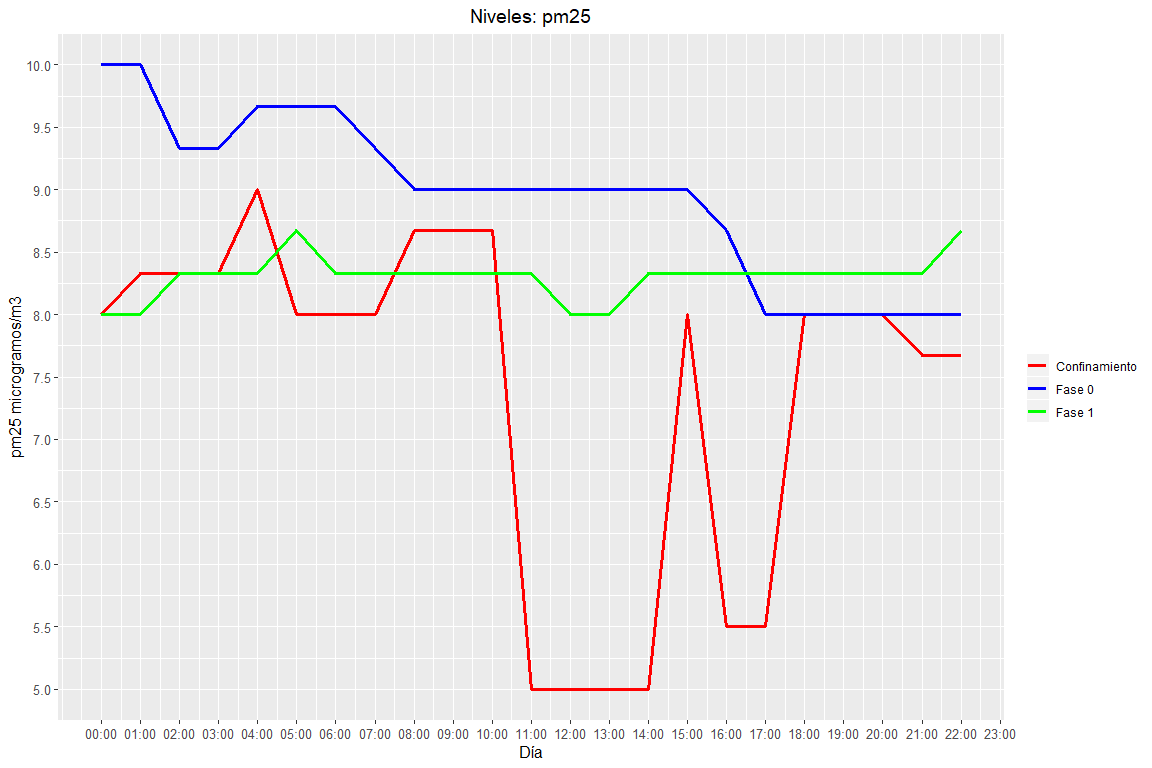
Regarding PM2.5, clear differences are observed between the confinement stage and the others 2, being the latter the ones that take quite similar values.
-1.3.2.4 SO2 (Sulfur dioxide)
Then, SO2 values will be displayed during the time period described above, every Wednesday of every week:
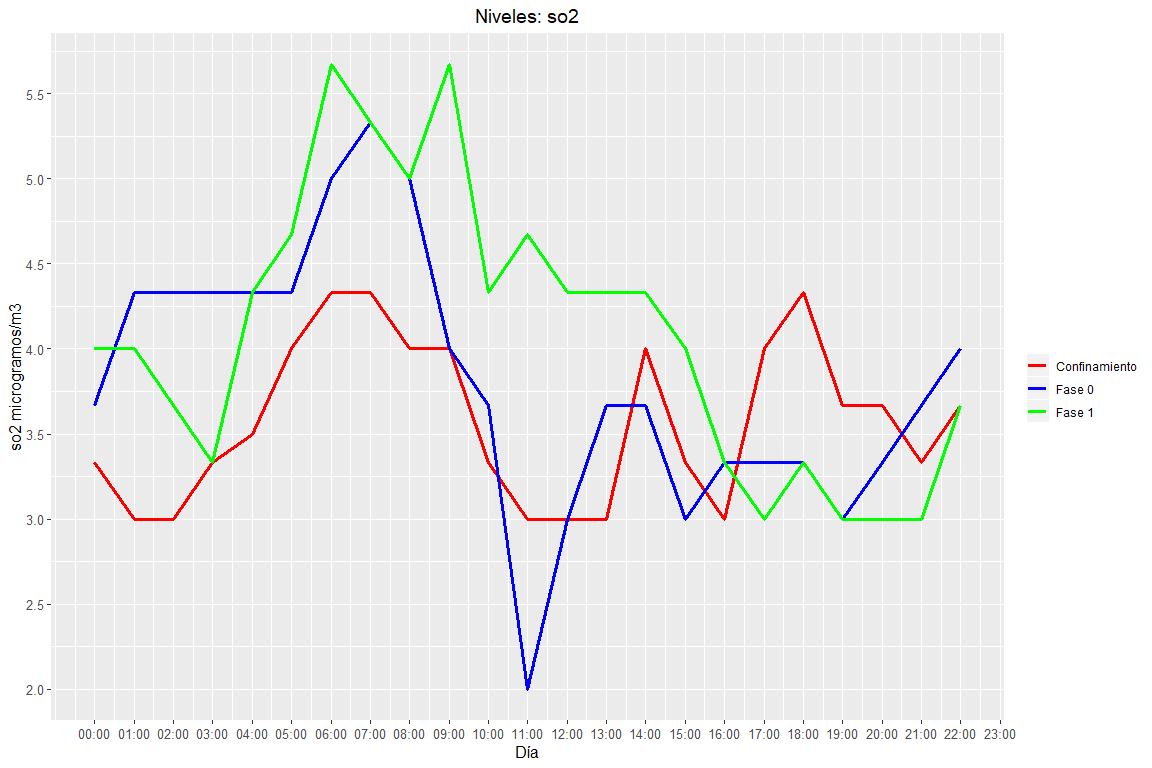
The trend in SO2 is similar in this graph but it is observed that, in the phase 1 the highest values are maintained. Instead, the phase 0 and the confinement stage show quite similar behaviors.
-1.3.2.5 O3 (Ozone)
Then, O3 values will be displayed for the time period described above, every Wednesday of every week:
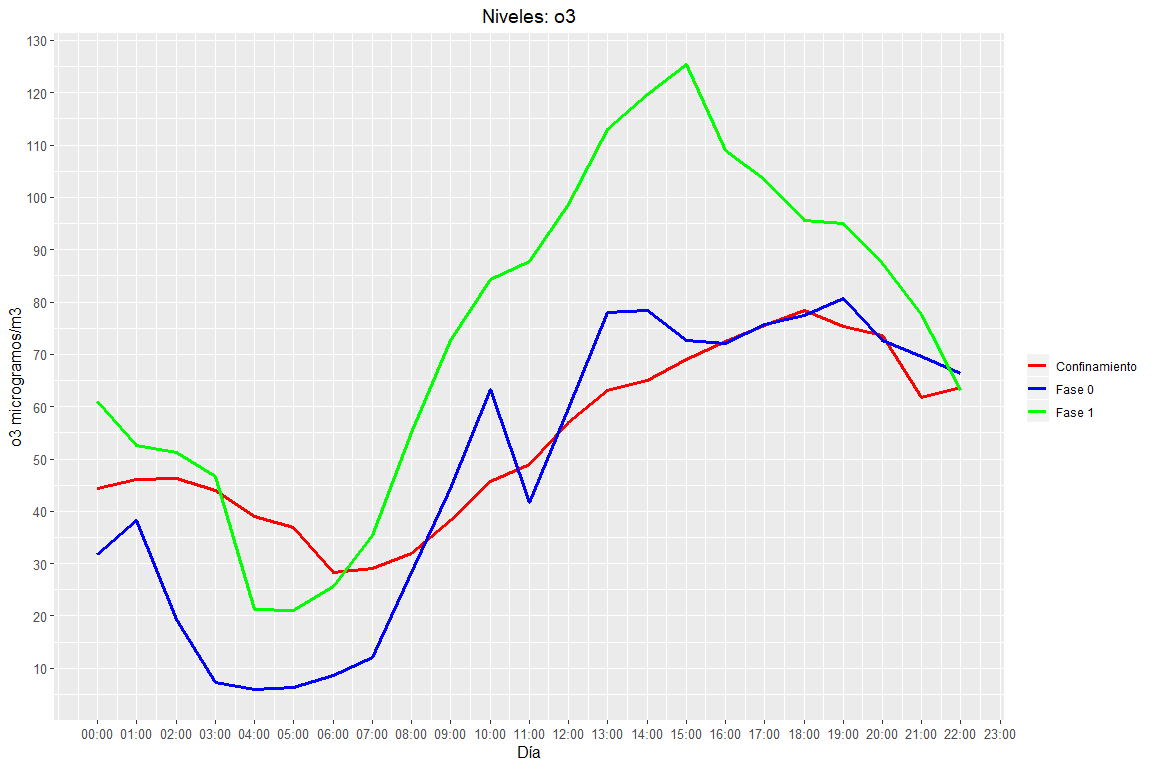
In the same way as in the previous graph, the phase 1 maintains the highest ozone values, leaving the other two stages very similar trends.
3 Conclusions
Conclusions about pollution and traffic in confinement, phase 0 and phase 1
3.1 Traffic and pollution evolution of the different phases
In the end, it follows that, as the CoVID-19 virus de-escalation progresses, more freedoms are granted to city dwellers, causing a clear increase in the number of vehicles on the roads of Valencia. This increase in traffic translates into a growth in pollutants derived from automobiles.
Thanks to the previous study, as a result, comparisons are obtained by graphs that reinforce this deduction: traffic and pollutants have increased as progress has been made in de-escalation.
Bibliography:
Contamination and confinement traffic