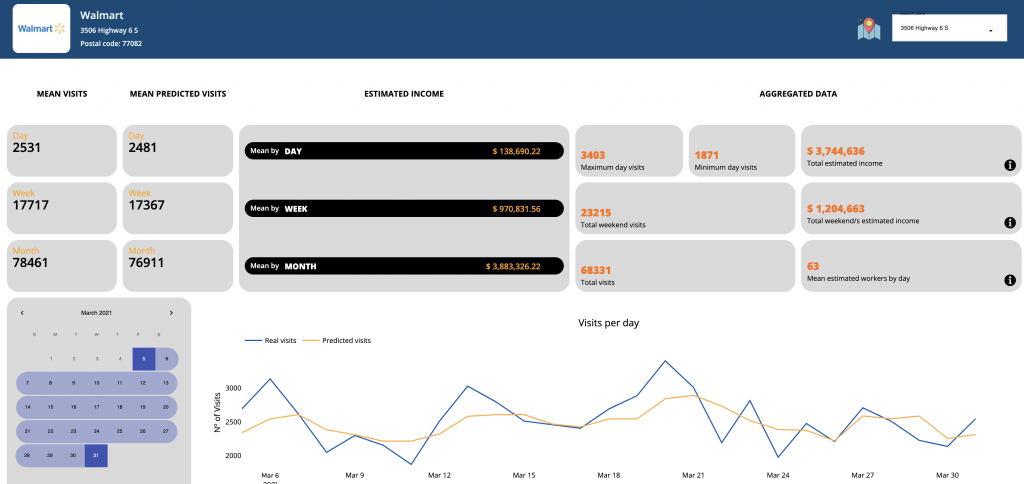
The model has been created from data patterns by the company SafeGraph. For this we have chosen four representative American businesses Subway, Walmart, Starbucks y Old Navy. Due to the fact that we only had data from 2020 and 2021, we wanted to choose a place where the COVID period was not extremely significant so that we could use both years for model training. Our selection was Houston, Texas, as restrictions there were not as strict and prolonged as in other states and data patterns were hardly affected by COVID-19.
Technical description of the project:
https://entredatos.es/costomize-predicting-the-number-of-visits-of-a-store-by-day/
Examples of model success:
– https://entredatos.es/project2021-costomize/success-stories
Dashboard examples:
https://entredatos.es/project2021-costomize/dashboard-example-subway
https://entredatos.es/project2021-costomize/dashboard-example-starbucks
https://entredatos.es/project2021-costomize/dashboard-example-walmart
https://entredatos.es/project2021-costomize/dashboard-example-oldnavy
The data displayed on the dashboard is part of the validation data, so the predicted visits are relative to the validation data (not seen by the model). We have limited the data to a single month since it is a mockup of a possible start-up.
Code repository: https://github.com/angel-langdon/Project2021
(Datasets have been removed from the repository due to SafeGraph data policy)
DISCLAIMER: It is a university project, we are not going to continue with him and we are not making money. It is more oriented to the construction of a Portfolio and to university research.

