
This analysis is part of the TFG made by Andriana Ivashkiv, for more information go to this link
Analysis performed by Andriana Ivashkiv: https://www.linkedin.com/in/kateryna-andriana-ivashkiv-shulhan-a833ba193/

ANALYSIS OF THE DETERMINING FACTORS OF CRIMINALITY
This study is carried out with data extracted from the statistics of the Ministry of the Interior and the National Institute of Statistics (OTHER). As both organizations are closely linked in their activity, it can be affirmed that the contrast of the information from these two sources is reliable. Also, the data collected will correspond only to 2017, since this is the last year for which statistics are available on some of the factors to be analyzed. Likewise, the calculations in this section will only be carried out with the crimes for each 100.000 inhabitants of the year 2017.
In this way, a correlation study between crimes and various factors of each autonomous community will be carried out; aging index, percentage of foreigners, tourism, PIB per cápita, average annual income, at-risk-of-poverty rate, unemployment rate, education level, drop out of education, spending on education, spending on culture and social work units. This will check if there is a direct relationship, inverse or there is no relationship between the variables. Later, and taking into account the results obtained, the corresponding bar graph will be interpreted.
AGING OF THE POPULATION
First, a correlation study will be carried out to find out if the aging of the population influences criminal activity in a territory. The dependent variable (and) are the crimes for each 100.000 population, while the independent (x) is the aging index[1]. Thus, the following values are obtained:
- Correlation coefficient: 0,68
- Determination coefficient: 0,47
- P-value: 0,001
- x = 1600,03 – 5 * and
Because the correlation coefficient is closer to 1 what to 0, it can be said that the relationship between the variables is moderately strong. On the other hand, the coefficient of determination shows that the aging index explains the 47% of criminal activity. Finally, p-value is less than 0,05, so there is a statistically significant relationship between both variables.
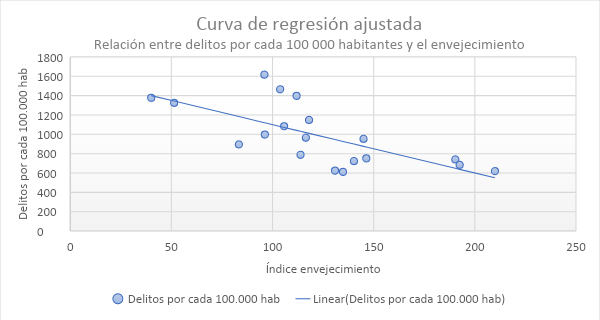
Graphic 18. Own elaboration
The graph shows a decreasing regression line. This indicates that, the higher the rate of aging of the population, fewer crimes committed for each 100.000 population. Definitely, the values indicate that both variables are linked, although not enough to explain to the 100%.
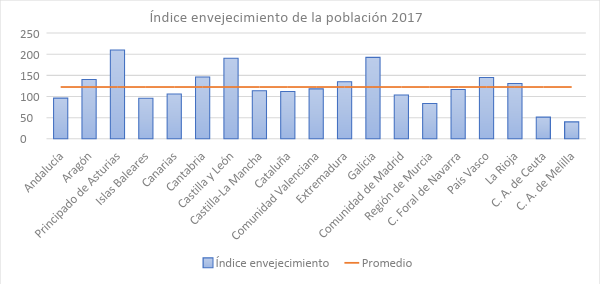
Graphic 19. Own elaboration
Through observing the bar graph and, taking into account the inverse relationship between the variables, It can be seen that some of the areas that are above the national aging average have a medium or low crime rate (Principality of Asturias, Castile and León or Galicia, for example). On the contrary, areas with less aging populations experience higher crime rates (Balearic Islands, Community of Madrid or the Autonomous Cities of Ceuta and Melilla).
FOREIGN POPULATION
The following correlation study adopts crimes for each 100.000 inhabitants as a dependent variable (and) and the percentage of foreigners as an independent variable (x)[2]. So that, these values are obtained:
- Correlation coefficient: 0,73
- Determination coefficient: 0,53
- P-value: 0,0003
- x = 482,96 + 55,34 * and
The first value indicates a relationship and the coefficient of determination states that the model explains a 53% of the data. Finally, the p-value is much lower than 0,05, so there is a significant statistical relationship between the variables.
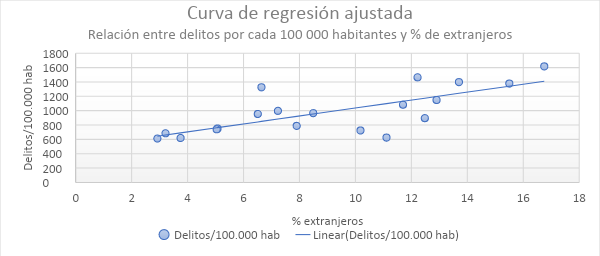
Graphic 20. Own elaboration
The increasing regression line indicates that the more foreigners there are in a territory, the more crimes are committed, thus existing a significant direct relationship, although not total, between both variables.
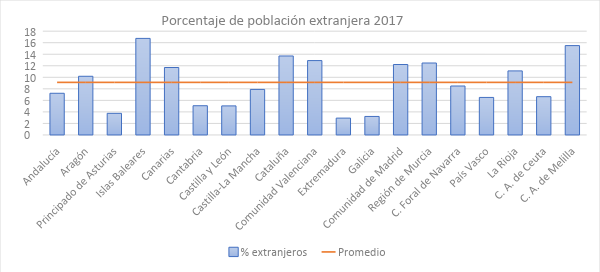
Graphic 21. Own elaboration
Then, the bar graph confirms that some of the communities with a higher percentage of immigrants coincide with those with the highest crime rates, as Balearic Islands, Catalonia or the Community of Madrid. On the contrary, some of the territories with the least immigration have the least crime, as Principality of Asturias, Extremadura or Galicia. However, It should be noted that Aragon and La Rioja also have more foreigners than the national average despite being communities with a medium-low crime rate..
TOURISM
The correlation study uses crimes for each 100.000 inhabitants as a dependent variable (and) and the number of tourists as an independent variable (x)[3]. It should be mentioned that tourism data is not converted to each 100.000 population, since this factor is considered to be more related to the type of leisure that can be done in the destination place than to its population. However, it is convenient to take into account the extension of each territory when interpreting the results. Also, add that the Autonomous Cities of Ceuta and Melilla do not appear in the INE database for this section, so they will not be taken into account. In this way, the following values are obtained:
- Correlation coefficient: 0,8
- Determination coefficient: 0,62
- P-value: 0,0001
- x = 756,6 + 3,91 * and
The first data indicates that there is a strong relationship between the variables, it is quite close to 1. Also, the coefficient of determination shows that tourism data explain up to a 62% of crimes committed by each 100.000 population. Regarding the p-value, this is much less than 0,05. Thus, variables are statistically significantly related.
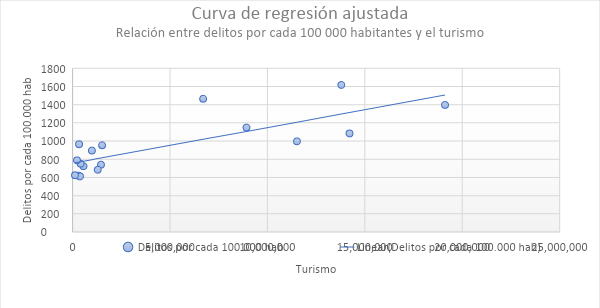
Graphic 22. Own elaboration
The regression line is increasing, indicating that when there is more tourism in a territory, more crimes are committed. Taking into account this direct relationship and the previously obtained values, it can be said that there is a fairly strong connection between the variables.
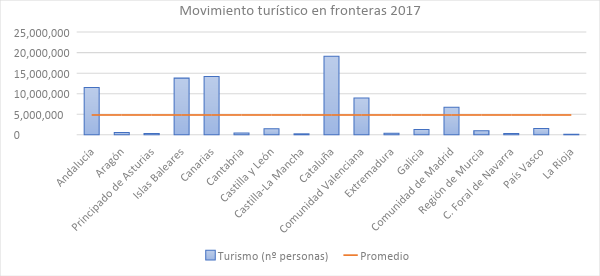
Graphic 23. Own elaboration
The bar graph indicates that almost all the communities that are above the average number of tourists per year have the highest crime rates. (Balearic Islands, Catalonia or Community of Madrid). On the other hand, the communities where there is a proven lower crime rate, They are the ones with the least tourism (Principality of Asturias, Cantabria or Extremadura). From what has been observed, criminal activity in Spain increases considerably in areas washed by the Mediterranean coast (except the capital). In the same way, it is common for coastal areas with a warm climate to attract a greater number of tourists. Thus, no wonder both variables are related.
START PER CÁPITA
The following correlation analysis collects crimes for each 100.000 inhabitants as a dependent variable (and) and the GDP per capita of each autonomous community as an independent variable (x)[4]. The results are the following:
- Correlation coefficient: 0,25
- Determination coefficient: 0,06
- P-value: 0,28
- x = 590,72 + 0,01 * and
As you can see, the correlation coefficient indicates that the relationship between both variables is weak, since the value is close to 0. Also, the coefficient of determination shows that the model only explains a 0,6% of the data. In the same way, the p-value is considerably greater than 0,05, Therefore, there is no statistically relevant relationship between the crimes committed and the GDP per capita of the autonomous communities.
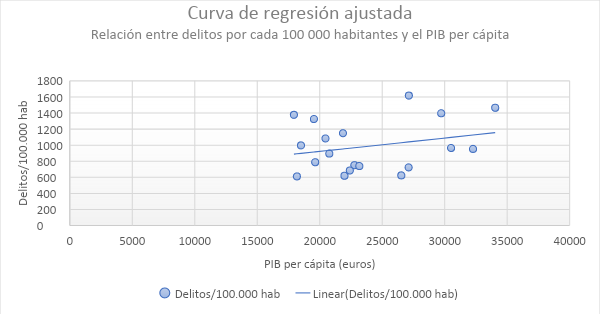
Graphic 24. Own elaboration
The regression line is increasing, which would indicate a direct relationship between x and y. However, the results show that the connection between the variables is almost non-existent, Therefore, it can be said that the GDP of each community is not capable of effectively explaining crime.
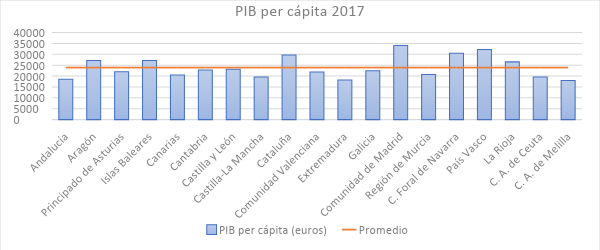
Graphic 25. Own elaboration
For his part, the bar graph shows that the territories with a GDP above the average are both those with a high crime rate (Balearic Islands or Catalonia) such as those with a medium or low index (Aragon or La Rioja). Definitely, there is no relationship between these two factors.
AVERAGE ANNUAL HOUSEHOLD INCOME
The following correlation study establishes the crimes for each 100.000 inhabitants as a dependent variable (and) and the average annual income of households as an independent variable (x)[5]. The values obtained are shown below:
- Correlation coefficient: 0,5
- Determination coefficient: 0,25
- P-value: 0,02
- x = -71,1 + 0,03 * and
The first data indicates that there is a median relationship between the variables, although this is relatively weak being in the middle of the 0 and from 1. Also, the coefficient of determination shows that tourism data would only explain a 25% of crimes committed by each 100.000 population. Regarding the p-value, this is less than 005. Thus, the variables are statistically significantly related.
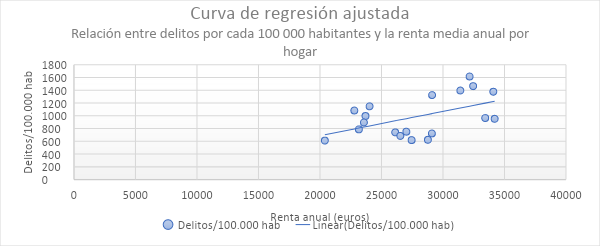
Graphic 26. Own elaboration
The regression line is increasing, which shows a direct relationship between both variables. That is to say, the higher the number of average annual income, greater number of crimes. However, the connection between the two factors is not strong enough to validate the explanation of the crime through income. Also, It is interesting to add that on numerous occasions a relationship between crime and poverty has been established (bibliography annex). Thus, if the connection between the variables was stronger, it would be an interesting topic to analyze in greater depth due to the contradiction that.
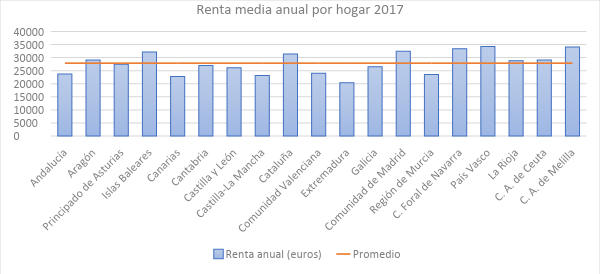
Graphic 27. Own elaboration
As can be seen in the bar chart, Communities with an annual income above the average are both those with high crime rates (Autonomous City of Ceuta and Autonomous City of Melilla) like those that have a medium or low crime (Glass Country or La Rioja). In the same way, there are areas with both high and low crime rates whose income is below average (Valencian Community or Extremadura) (annexed). In summary, mean annual income does not have a strong enough relationship with criminal activity to be explanatory.
POVERTY RISK
This correlation analysis adopts crimes for each 100.000 inhabitants as a dependent variable (and) and the at-risk-of-poverty rate for each territory as an independent variable (x)[6]. It is noteworthy to mention that the risk of poverty has been calculated by the INE from the average annual income of the previous year. The results obtained are the following:
- Correlation coefficient: 0,14
- Determination coefficient: 0,01
- P-value: 0,56
- x = 883,27 + 4,94 * and
The correlation coefficient indicates that the relationship between the risk of poverty and crime is very weak. Also, the coefficient of determination shows that the model only explains the 0,01% of the data. That is to say, practically does not explain any data. For his part, p-value is greater than 0,05, therefore, there is no statistically relevant relationship between the variables.
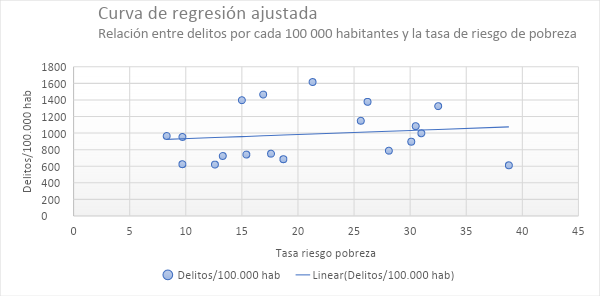
Graphic 28. Own elaboration
The regression line is increasing, which would indicate a direct relationship between x and y. However, the connection between both variables is extremely weak, so this has no relevance.
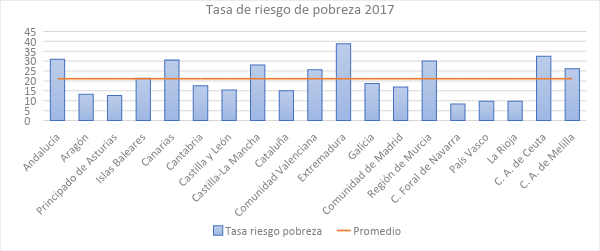
Graphic 29. Own elaboration
The bar graph allows identifying territories in the country with a low risk of poverty rate, but with a high crime (Catalonia or Autonomous City of Ceuta), or with a high risk rate, but low crime (Estremadura). That is to say, the relationship between the variables is practically non-existent in this case.
UNEMPLOYMENT
This correlation study presents crimes for each 100.000 inhabitants as a dependent variable (and) and the unemployment rate as an independent variable (x)[7]. The data will be relative to the population that is between the 25 and the 64 year old. So that, the values obtained are the following:
- Correlation coefficient: 0,05
- Determination coefficient: 0,003
- P-value: 0,82
- x = 934,29 + 3,43 * and
As can be seen with the first data, the relationship between the variables is practically nil, and the coefficient of determination indicates that unemployment explains only a 0,03% of crime. Likewise, the p-value is much greater than 0,05, Therefore, it is confirmed that there is no statistically relevant relationship between the variables.
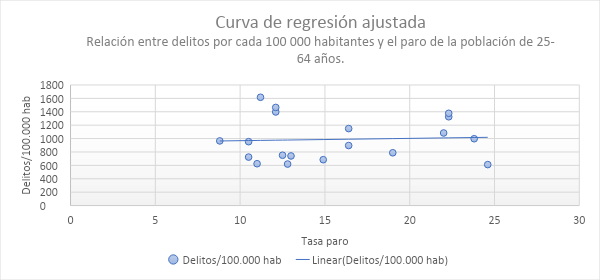
Graphic 30. Own elaboration
The regression line is slightly increasing. However, because there is no relationship between the population that is unemployed in each autonomous community and the crimes that are committed in it, this graph is not taken into account.
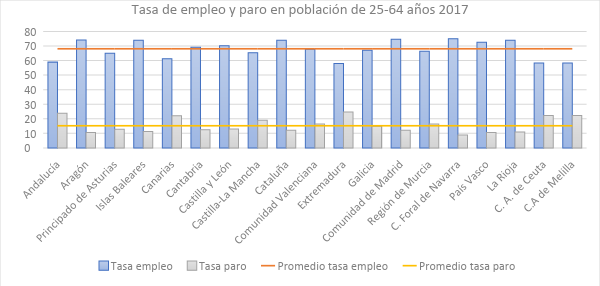
Graphic 31. Own elaboration
In this case, the bar graph shows both the employment and unemployment rates. First, It can be seen that there are communities that are below the average unemployment rate and that have both a high and low crime rate (Community of Madrid or Asturias). The same occurs with areas that are above the unemployment average., because there are some communities with a high crime rate (Autonomous City of Ceuta) and others with a low index (Estremadura). Also, the same happens with the employment rate, which means that there is no significant relationship between this and crime.
EDUCATION LEVEL
The analysis of this section is carried out through a multiple correlation study, establishing the crimes for each 100.000 inhabitants as a dependent variable (and). The independent variables (x) are the following; index of the population with the first stage of secondary school completed (x1), Population index with completed upper secondary school (x2) and index of the population with higher education (x3)[8]. Also, It should be emphasized that the data are relative to the population that is among the 25 and 64 year old. In this way, The results are the following:
- Correlation coefficient: 0,62
- R2 tight: 0,26
- P-value of x1: 0,03
- P-value of x2: 0,04
- P-value of x3: 0,03
- Ŷ = 237299,71 – 2376,84 * x1 – 2314,61 * x2 – 2376,32 * x3
First, the correlation coefficient indicates that the relationship between the variables is moderately strong, it is closer to 1 that to 0. On the other hand, el R2 adjusted shows that the model only explains a 26% of the data, which is little, well there is a 74% unexplained data. In the case of multiple regression, the coefficient of determination is not observed because it tends to increase when there are several independent variables, so the R is taken into account2 tight. Finally, the p-value of all independent variables is less than 0,05, so we can see that there is a statistically significant relationship between them.
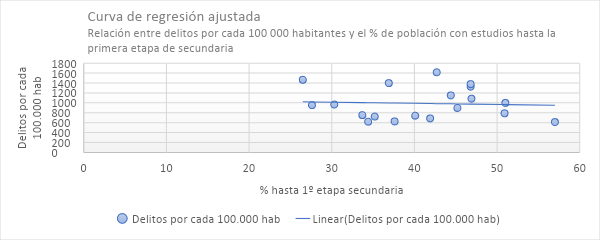
Graphic 32. Own elaboration
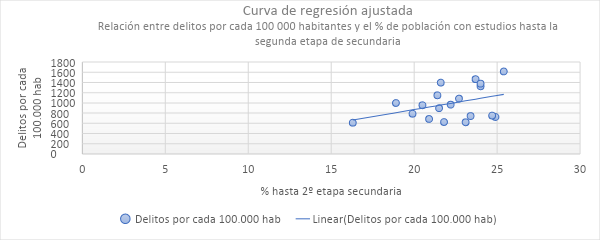
Graphic 33. Own elaboration
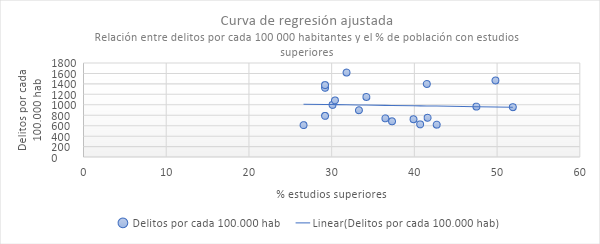
Graphic 34. Own elaboration
The graph relative to the population with studies up to the first stage of secondary school is slightly decreasing, which would indicate that the greater number of people who have up to the first stage of secondary, less crime. The figure relating to the population with studies up to the second stage of secondary school is growing and shows that, more people with studies up to the second stage of secondary school, more crimes. Finally, the reference to the population with higher education is slightly decreasing, so how many more people there are with higher education, less crime. Definitely, there is a not very strong relationship between the variables, getting to explain only one 26% of the data.
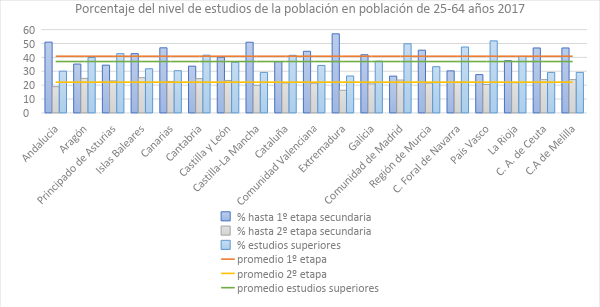
Graphic 35. Own elaboration
As can be seen in the bar graph, the highest national average is that of people who have up to the first stage of secondary school, followed by the average of higher education and ending with the average of people who have studies up to the second stage. However, there is no clear relationship between the level of studies and the crimes committed in the autonomous community.
EARLY WITHDRAWAL FROM EDUCATION
Continuing the field of education, the following correlation analysis adopts crimes for each 100.000 inhabitants as a dependent variable (and) and the rate of early school leaving as an independent variable (x)[9]. It should be noted that the dropout rate data are relative to the population that has between 18 and 24 year old. Thus, The results are the following:
- Correlation coefficient: 0,41
- Determination coefficient: 0,17
- P-value: 0,07
- x = 567 + 23,96 * and
The correlation coefficient indicates that there is a weak relationship between the variables x and y, it is closer to 0 what to 1. The coefficient of determination shows that early school leaving only explains a 17% of crime, quite a low percentage. Also, p-value is greater than 0,05, so the variables do not have a statistically significant relationship.
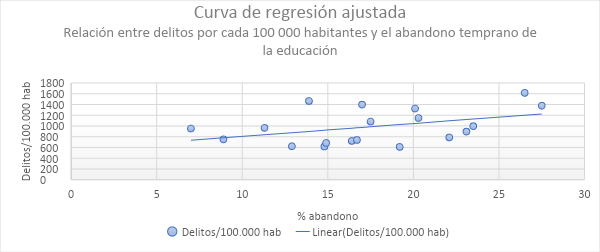
Graphic 36. Own elaboration
The regression line is increasing, which would indicate that when more dropouts from education there are, more crimes are committed. However, there is not enough relationship between the variables to accept this model, so the graph is not relevant.
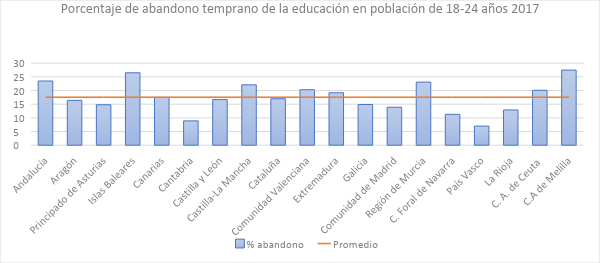
Graphic 37. Own elaboration
The bar graph shows that both communities with high and low crime rates may be above the average dropout rate. (Balearic Islands or Castilla-la Mancha, for example). Likewise, they can also be below (Cantabria or Community of Madrid). Definitely, It is not confirmed that the rate of early school leaving explains the criminal activity of an autonomous community.
PUBLIC SPENDING ON EDUCATION
To end with the educational field, a correlation study is carried out that collects crimes for each 100.000 inhabitants as a dependent variable (and) and spending on education for each 100.000 inhabitants as a dependent variable (x)[10]. The values obtained are:
- Correlation coefficient: 0,45
- Determination coefficient: 0,20
- P-value: 0,05
- x = 1433,16 – 5,14 * and
The correlation coefficient denotes a weak relationship between the variables x and y, it is even lower than 0,5. Also, the coefficient of determination indicates that spending on education explains only a 20% of crimes. For his part, the p-value is 0,05, so there would be a statistically relevant relationship.
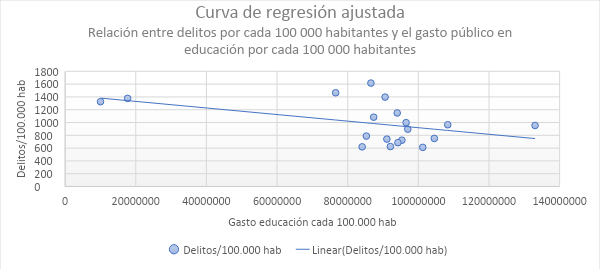
Graphic 38. Own elaboration
The regression line is decreasing, indicating an inverse relationship between x and y. That is to say, higher spending on education by autonomous community, lower commission of crimes. However, the values obtained in the study show an insufficient connection between the variables, so this model is not accepted.
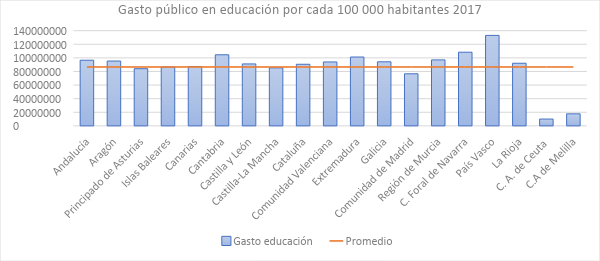
Graphic 39. Own elaboration
The bar graph shows slightly that communities with a lower crime rate are more likely to invest in education than communities with more crime. For example, Cantabria or the Basque Country have higher spending than Catalonia or the Valencian Community. However, this is not enough, since the correlation study determines that spending on education is not capable of adequately explaining crime.
PUBLIC SPENDING ON CULTURE
The following correlation analysis will take crimes for each 100.000 inhabitants as a dependent variable (and) and public spending on culture for each 100.000 inhabitants as an independent variable (x)[11]. The values are as follows:
- Correlation coefficient: 0,23
- Determination coefficient: 0,05
- P-value: 0,33
- x = 890,08 + 3,05 * and
The first data indicates a very weak relationship between spending on culture and crimes by autonomous community. Also, the coefficient of determination shows that the model is barely able to explain a 0,5% of the data. To this, it should be added that the p-value is considerably higher than 0,05, so there is no statistically significant relationship between x and y.
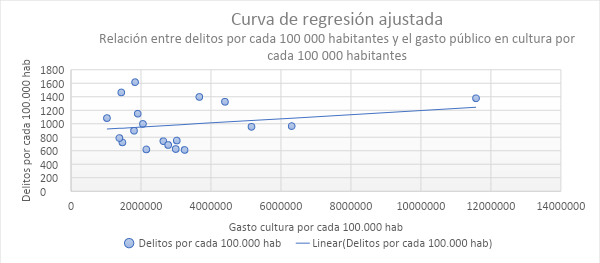
Graphic 40. Own elaboration
The regression line is increasing, which would mean that, the higher spending on culture, highest commission of crimes. However, This is denied because the data show that there is no relationship between cultural spending for each 100.000 inhabitants and crimes committed by each 100.000 population.
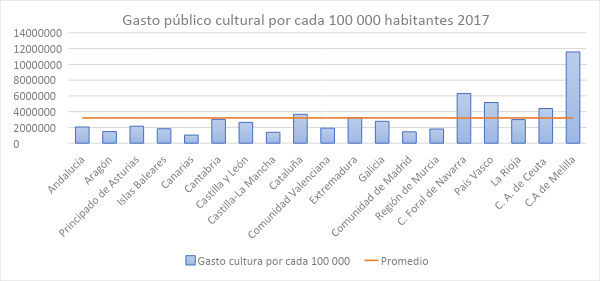
Graphic 41. Own elaboration
Like the correlation study, the bar chart does not show at first glance any type of relationship between spending on culture and crimes committed. Territories with a high crime rate, like the city of Melilla, have spending on culture above the average. Likewise, so do other communities with a medium-low index, such as the Foral Community of Navarra or the Basque Country (annexed).
SOCIAL WORK UNITS
The Social Work Unit (UTS) It is any administrative and territorial unit whose main function is to assist citizens in their access to Social Services, especially through an Information and Guidance Service. It is the most basic level of the Public Social Services System and carries out the following activities: promotional and awareness actions, systematic studies of the social needs of the population and technical cooperation in comprehensive programs of promotion and social insertion.
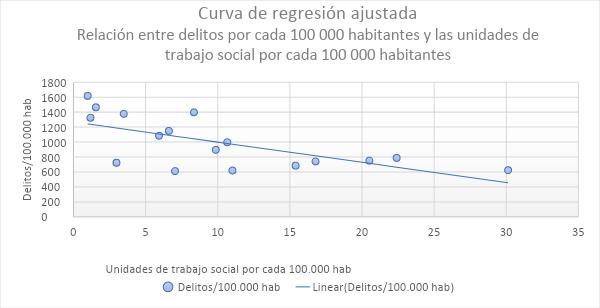
So that, This correlation analysis collects crimes for each 100.000 inhabitants as a dependent variable (x) and the Social Work Units for each 100.000 inhabitants as an independent variable (and)[12]. It is important to add that this section does not contain data for either the Navarra Regional Government or the Basque Country because they have a special economic regime. In this way, the values obtained are the following (annexed):
- Correlation coefficient: 0,66
- Determination coefficient: 0,44
- P-value: 0,03
- x = 1268,37 – 26,95 * and
The correlation coefficient indicates that there is a moderately strong relationship between the variables. On the other hand, the coefficient of determination shows that the social work units explain the crimes committed in a 44%, a little less than half. The p-value is less than 0,05, so it can be said that there is a statistically significant relationship of x and y.
Graphic 42. Own elaboration
The regression line is decreasing, showing an inverse relationship between the variables. That is to say, the greater the number of social work units, less crime. This model can be accepted, although with caution. There is a relationship between x and y, but this is not excessively strong. Thus, more studies in the field of social work would be advisable.
Graphic 43. Own elaboration
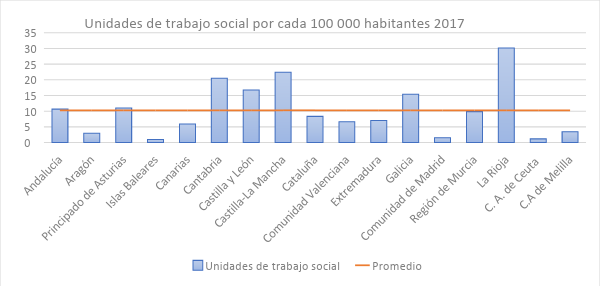
The bar graph shows that, effectively, several of the communities with the lowest crime rate are those that are above the average in social work units (Castile and Leon, Castilla-La Mancha and La Rioja, for example). On the contrary, communities with the highest crime rates are below average (Catalonia, Valencian Community or Community of Madrid).
RESULTS AND CONCLUSIONS OF THE SECTION
The correlation study has shown that the factors that are related, to a greater or lesser extent, with the number of crimes committed by each 100.000 population, son: aging population, foreign population, tourism, educational level and social work units.
Out of these, the most explanatory element of crime is tourism. There is a strong and direct relationship between both variables, with a correlation coefficient of 0,8 and with an explanation of the 62% of the data. According to studies done on the matter, tourism can have a double effect on crime. First, tourism activity generates greater job opportunities and higher wages than in other sectors, which means a higher opportunity cost for the commission of crimes. However, it also creates new opportunities for criminals[13]. For example, it is common for tourists to carry cash or valuables with them. If to this is added a more passive and careless attitude than the residents of the area, the result is that they become an attractive target for the criminal[14]. It is also possible that tourists are the perpetrators and not the victims. This is because, not being in your usual environment, they change their behavior to one that is more uninhibited and with a lower degree of responsibility. Also, this may increase if the tourist destination is related to environments in which alcohol and drugs are present[15].
The second most influential factor in criminal activity is the foreign population. It presents a correlation coefficient of 0,73 and it can be said that the model explains a 53% of the data. Thus, and according to the results of this study, how much more immigration, more crime. However, Several authors are beginning to discover that immigration and crime have a negative relationship. Alonso-Borrego, Garoupa and Vázquez [16] carried out a study on the link between these two variables, with an exhaustive approach and supported by economic analysis. They observed that, during strong immigration years, Spain saw its crime grow at a rate similar to that of population growth (the growth of crime and the foreign population were explained by 50%). Although Spain was the recipient of more foreigners than other European countries, crime growth was lower than in places with fewer immigrants. This also happened in other countries of the world, Therefore, elements were found that show that the increase in foreigners prevents crime rates from also increasing. (and which should be taken into account when conducting studies). These factors can be education or gender, This does not mean that there are no groups of immigrants with a lower educational level that contribute to the growth of crime..
In the same way, Garcia Spain[17] affirms that more and more investigations recognize that there is less crime in countries with a larger immigrant population. Foreigners tend to have a lower crime rate than nationals and are more resistant to crime in disorganized contexts. However, since crime is a multi-causal phenomenon and the criminal activity of immigrants is very diverse, it would be inappropriate to say that these variables are fully explained without taking into account other conditioning factors analyzed by empirical research.
Continuing with the correlation study carried out in this work, it has been observed that the aging of the population occupies the third position of the determinants of crime. The model shows an inverse relationship, with a correlation coefficient of 0,68 and an explanation of the 47% of the data. This means that, if a community has a higher rate of aging, it also has a lower crime rate. Thus, one might venture that young people commit more crimes than older people. If the data of convicted adults are consulted in 2017 provided by the INE[18], it is observed that the 8,97% of condemned had of 18 a 20 years, he 14,66% of 21 a 25 years, he 14,46% of 26 a 30 years, he 14,65% of 31 a 35 years, he 14,20% of 36 a 40 years, he 20,34% of 41 a 50 years, he 8,91% of 51 a 60 years, he 2,87% of 61 a 70 years and the 0,89% had more than 71 years. As you can appreciate, he 66,94% of detainees is among the 18 and 40 year old. After, a peak occurs between 41 and the 50 and, Finally, the number of convicts begins to decrease drastically in ages of more than 50 years. In addition to these data, It must also be taken into account that there is a figure for juvenile delinquency: “It begins around the 13/14 years, begins to decline in late adolescence (18 years), it is done in the company of others and the most frequent behaviors continue to be alcohol consumption, shoplifting, the fights and vandalism "[19].
The fourth place belongs to the Social Work Units (UTS) as far as determining factors of crime are concerned. The correlation coefficient is 0,66 and it is indicated that the variable explains a 44% of crime in the autonomous communities. The relationship that has been established is inverse, that is to say, the higher the number of UTS, lower crime rate. As it mentioned above, These are the administrative units whose essential function is to assist citizens in their access to Social Services, thus forming the most basic level of this structure of the Public System. As they are only the most basic level, the scope of Social Work is much more extensive and the investment of the State in this matter is also. As Pastor indicates[20], social initiative entities have become one of the most important elements in the Welfare Society. Also, multiculturalism due to immigration requires action in socio-labor integration and care for citizens without a family nucleus or coexistence.
Although Social Work does not consist directly in the prevention and treatment of crime like Criminology, their work does affect and improve the quality of life of the population that may present risk factors for criminal behavior. Thus, it would be convenient to carry out in-depth studies in this matter, thus finding out if there really is an inverse relationship between social work and the crime rate.
To end, educational level is the last factor that has presented a certain relationship with crime. The correlation coefficient is 0,62, although this variable can only explain a 26% of crime. Thus, it cannot be said that both variables are explained effectively. However, perhaps the determining factor is not the level of education of the population, but the quality of education itself. A study from the University of Cádiz, carried out by Ruiz-Morales[21], encompasses this unknown. This calculates the correlation between crimes in the autonomous communities and educational quality according to the PISA Report (a global education evaluation system). Likewise, the correlation between crime and the population's education level is also calculated. The results of the study regarding educational quality show that it has a strong degree of inverse relationship with crime. That is to say, the higher the quality of education, lower crime. However, and just like in this job, the results of the correlation study regarding the level of education do not indicate a relationship, thus contradicting the empirical literature on the subject.
Regarding the rest of the factors, no significant relationship could be found between the variables. The one that comes closest to explaining crime is the average annual income per household, with a correlation coefficient of 0,5 and with an explanation of the 25% of the data. However, this relationship is considered too weak to accept the predictive value of the model. Thus, economic or employment variables are not able to explain the crime rate effectively (PIB per cápita, average annual household income, at-risk-of-poverty rate and unemployment rate). This coincides with the study by Rodríguez Andrés[22], the results of which determine that demographic variables seem to have a greater impact than socio-economic variables in explaining crime levels.
Likewise, The variables chosen in the field of education are not decisive either (index of educational level and public spending on education) or in the culture (public spending on culture). On this last case, It is possible that it is more revealing to choose the average per capita expenditure on cultural activities than the state public expenditure on culture. However, this possibility is left for possible future research.
ANNEXES
Table 17, graphic 18 and 19: Relationship between the aging of the population and crimes for each 100.000 population.
| 2017 | ||
| Crimes | % aging | |
| Andalusia | 997,42 | 96,21 |
| Aragon | 723,55 | 140,25 |
| Principality of Asturias | 619,63 | 209,95 |
| Balearic Islands | 1616,42 | 96 |
| Canary Islands | 1083,417 | 105,73 |
| Cantabria | 751,341 | 146,34 |
| Castile and Leon | 740,72 | 190,36 |
| Castilla la Mancha | 787,67 | 113,83 |
| Catalonia | 1397,21 | 111,87 |
| Valencian Community | 1148,95 | 118,05 |
| Estremadura | 611,41 | 134,81 |
| Galicia | 684,68 | 192,51 |
| Madrid's community | 1464,69 | 103,76 |
| Murcia region | 895,92 | 83,38 |
| C. Foral of Navarra | 964,96 | 116,49 |
| Basque Country | 953,52 | 144,99 |
| The Rioja | 624,4 | 130,9 |
| C. A. of Ceuta | 1325,05 | 51,35 |
| C. A. from Melilla | 1377,14 | 40,02 |
Table 18, graphic 20 and 21: Relationship between the percentage of foreigners and crimes for each 100.000 population.
| 2017 | ||
| Crimes | % foreign | |
| Andalusia | 997,42 | 7,23 |
| Aragon | 723,55 | 10,18 |
| Principality of Asturias | 619,63 | 3,75 |
| Balearic Islands | 1616,42 | 16,75 |
| Canary Islands | 1083,417 | 11,7 |
| Cantabria | 751,341 | 5,07 |
| Castile and Leon | 740,72 | 5,04 |
| Castilla la Mancha | 787,67 | 7,9 |
| Catalonia | 1397,21 | 13,7 |
| Valencian Community | 1148,95 | 12,9 |
| Estremadura | 611,41 | 2,92 |
| Galicia | 684,68 | 3,21 |
| Madrid's community | 1464,69 | 12,22 |
| Murcia region | 895,92 | 12,48 |
| C. Foral of Navarra | 964,96 | 8,49 |
| Basque Country | 953,52 | 6,51 |
| The Rioja | 624,4 | 11,11 |
| C. A. of Ceuta | 1325,05 | 6,64 |
| C. A. from Melilla | 1377,14 | 15,5 |
Table 19, graphic 22 and 23: Relationship between the number of tourists and crimes for each 100.000 population.
| 2017 | ||
| Crimes | tourism | |
| Andalusia | 997,42 | 11.518.262 |
| Aragon | 723,55 | 562.352 |
| Principality of Asturias | 619,63 | 294.129 |
| Balearic Islands | 1616,42 | 13.792.296 |
| Canary Islands | 1083,417 | 14.214.222 |
| Cantabria | 751,341 | 414.489 |
| Castile and Leon | 740,72 | 1.458.546 |
| Castilla la Mancha | 787,67 | 226.221 |
| Catalonia | 1397,21 | 19.118.421 |
| Valencian Community | 1148,95 | 8.925.959 |
| Estremadura | 611,41 | 380.914 |
| Galicia | 684,68 | 1.291.086 |
| Madrid's community | 1464,69 | 6.699.785 |
| Murcia region | 895,92 | 991.209 |
| C. Foral of Navarra | 964,96 | 333.317 |
| Basque Country | 953,52 | 1.514.765 |
| The Rioja | 624,4 | 124.189 |
Table 20, graphic 24 and 25: Relationship between GDP per capita and crime for each 100.000 population.
| 2017 | ||
| Crimes | START € | |
| Andalusia | 997,42 | 18501 |
| Aragon | 723,55 | 27115 |
| Principality of Asturias | 619,63 | 21981 |
| Balearic Islands | 1616,42 | 27134 |
| Canary Islands | 1083,417 | 20457 |
| Cantabria | 751,341 | 22767 |
| Castile and Leon | 740,72 | 23169 |
| Castilla la Mancha | 787,67 | 19632 |
| Catalonia | 1397,21 | 29722 |
| Valencian Community | 1148,95 | 21859 |
| Estremadura | 611,41 | 18170 |
| Galicia | 684,68 | 22411 |
| Madrid's community | 1464,69 | 34041 |
| Murcia region | 895,92 | 20766 |
| C. Foral of Navarra | 964,96 | 30508 |
| Basque Country | 953,52 | 32267 |
| The Rioja | 624,4 | 26528 |
| C. A. of Ceuta | 1325,05 | 19537 |
| C. A. from Melilla | 1377,14 | 17934 |
Table 21, graphic 26 and 27: Relationship between average annual household income and crimes for each 100.000 population.
| 2017 | ||
| Crimes | Rent € | |
| Andalusia | 997,42 | 23699 |
| Aragon | 723,55 | 29098 |
| Principality of Asturias | 619,63 | 27454 |
| Balearic Islands | 1616,42 | 32163 |
| Canary Islands | 1083,417 | 22790 |
| Cantabria | 751,341 | 27024 |
| Castile and Leon | 740,72 | 26113 |
| Castilla la Mancha | 787,67 | 23159 |
| Catalonia | 1397,21 | 31411 |
| Valencian Community | 1148,95 | 24034 |
| Estremadura | 611,41 | 20395 |
| Galicia | 684,68 | 26533 |
| Madrid's community | 1464,69 | 32451 |
| Murcia region | 895,92 | 23574 |
| C. Foral of Navarra | 964,96 | 33431 |
| Basque Country | 953,52 | 34203 |
| The Rioja | 624,4 | 28775 |
| C. A. of Ceuta | 1325,05 | 29117 |
| C. A. from Melilla | 1377,14 | 34089 |
Table 22, graphic 28 and 29: Relationship between the at-risk-of-poverty rate and crimes for each 100.000 population.
| 2017 | ||
| Crimes | Poverty laughter rate | |
| Andalusia | 997,42 | 31 |
| Aragon | 723,55 | 13,3 |
| Principality of Asturias | 619,63 | 12,6 |
| Balearic Islands | 1616,42 | 21,3 |
| Canary Islands | 1083,417 | 30,5 |
| Cantabria | 751,341 | 17,6 |
| Castile and Leon | 740,72 | 15,4 |
| Castilla la Mancha | 787,67 | 28,1 |
| Catalonia | 1397,21 | 15 |
| Valencian Community | 1148,95 | 25,6 |
| Estremadura | 611,41 | 38,8 |
| Galicia | 684,68 | 18,7 |
| Madrid's community | 1464,69 | 16,9 |
| Murcia region | 895,92 | 30,1 |
| C. Foral of Navarra | 964,96 | 8,3 |
| Basque Country | 953,52 | 9,7 |
| The Rioja | 624,4 | 9,7 |
| C. A. of Ceuta | 1325,05 | 32,5 |
| C. A. from Melilla | 1377,14 | 26,2 |
Table 23, graphic 30 and 31: Relationship between the unemployment rate and crimes for each 100.000 population.
| 2017 | ||
| Crimes | Unemployment rate | |
| Andalusia | 997,42 | 23,8 |
| Aragon | 723,55 | 10,5 |
| Principality of Asturias | 619,63 | 12,8 |
| Balearic Islands | 1616,42 | 11,2 |
| Canary Islands | 1083,417 | 22 |
| Cantabria | 751,341 | 12,5 |
| Castile and Leon | 740,72 | 13 |
| Castilla la Mancha | 787,67 | 19 |
| Catalonia | 1397,21 | 12,1 |
| Valencian Community | 1148,95 | 16,4 |
| Estremadura | 611,41 | 24,6 |
| Galicia | 684,68 | 14,9 |
| Madrid's community | 1464,69 | 12,1 |
| Murcia region | 895,92 | 16,4 |
| C. Foral of Navarra | 964,96 | 8,8 |
| Basque Country | 953,52 | 10,5 |
| The Rioja | 624,4 | 11 |
| C. A. of Ceuta | 1325,05 | 22,3 |
| C. A. from Melilla | 1377,14 | 22,3 |
Table 24, graphic 32, 33, 34 and 35: Relationship between the educational level of the population and crimes for each 100.000 population.
| 2017 | ||||
| Crimes | % up to 1st secondary stage | % up to 2nd secondary stage | % higher education | |
| Andalusia | 997,42 | 51 | 18,9 | 30,1 |
| Aragon | 723,55 | 35,2 | 24,9 | 39,9 |
| Principality of Asturias | 619,63 | 34,4 | 23,1 | 42,7 |
| Balearic Islands | 1616,42 | 42,7 | 25,4 | 31,8 |
| Canary Islands | 1083,417 | 46,9 | 22,7 | 30,4 |
| Cantabria | 751,341 | 33,7 | 24,7 | 41,6 |
| Castile and Leon | 740,72 | 40,1 | 23,4 | 36,5 |
| Castilla la Mancha | 787,67 | 50,9 | 19,9 | 29,2 |
| Catalonia | 1397,21 | 36,9 | 21,6 | 41,5 |
| Valencian Community | 1148,95 | 44,4 | 21,4 | 34,2 |
| Estremadura | 611,41 | 57 | 16,3 | 26,6 |
| Galicia | 684,68 | 41,9 | 20,9 | 37,3 |
| Madrid's community | 1464,69 | 26,5 | 23,7 | 49,8 |
| Murcia region | 895,92 | 45,2 | 21,5 | 33,3 |
| C. Foral of Navarra | 964,96 | 30,3 | 22,2 | 47,5 |
| Basque Country | 953,52 | 27,6 | 20,5 | 51,9 |
| The Rioja | 624,4 | 37,6 | 21,8 | 40,7 |
| C. A. of Ceuta | 1325,05 | 46,8 | 24 | 29,2 |
| C. A. from Melilla | 1377,14 | 46,8 | 24 | 29,2 |
Table 25, graphic 36 and 37: Relationship between early school leaving and crimes for each 100.000 population.
| 2017 | ||
| Crimes | % abandonment | |
| Andalusia | 997,42 | 23,5 |
| Aragon | 723,55 | 16,4 |
| Principality of Asturias | 619,63 | 14,8 |
| Balearic Islands | 1616,42 | 26,5 |
| Canary Islands | 1083,417 | 17,5 |
| Cantabria | 751,341 | 8,9 |
| Castile and Leon | 740,72 | 16,7 |
| Castilla la Mancha | 787,67 | 22,1 |
| Catalonia | 1397,21 | 17 |
| Valencian Community | 1148,95 | 20,3 |
| Estremadura | 611,41 | 19,2 |
| Galicia | 684,68 | 14,9 |
| Madrid's community | 1464,69 | 13,9 |
| Murcia region | 895,92 | 23,1 |
| C. Foral of Navarra | 964,96 | 11,3 |
| Basque Country | 953,52 | 7 |
| The Rioja | 624,4 | 12,9 |
| C. A. of Ceuta | 1325,05 | 20,1 |
| C. A. from Melilla | 1377,14 | 27,5 |
Table 26, graphic 38 and 39: Relationship between spending on education for each 100.000 inhabitants and crimes for each 100.000 population.
| 2017 | ||
| Crimes | Education expenditure | |
| Andalusia | 997,42 | 96538386,27 |
| Aragon | 723,55 | 95346475,64 |
| Principality of Asturias | 619,63 | 84092621,95 |
| Balearic Islands | 1616,42 | 86575973,72 |
| Canary Islands | 1083,417 | 87356608,09 |
| Cantabria | 751,341 | 104525457 |
| Castile and Leon | 740,72 | 91089994,62 |
| Castilla la Mancha | 787,67 | 85290716,79 |
| Catalonia | 1397,21 | 90591040,3 |
| Valencian Community | 1148,95 | 94015714,63 |
| Estremadura | 611,41 | 101243795,9 |
| Galicia | 684,68 | 94208516,75 |
| Madrid's community | 1464,69 | 76593100,8 |
| Murcia region | 895,92 | 97017628,75 |
| C. Foral of Navarra | 964,96 | 108324187 |
| Basque Country | 953,52 | 133043199,3 |
| The Rioja | 624,4 | 92087031,24 |
| C. A. of Ceuta | 1325,05 | 10027189,82 |
| C. A. from Melilla | 1377,14 | 17698560,61 |
Table 27, graphic 40 and 41: Relationship between spending on culture for each 100.000 inhabitants and crimes for each 100.000 population.
| 2017 | ||
| Crimes | Culture expenditure | |
| Andalusia | 997,42 | 2056153,95 |
| Aragon | 723,55 | 1468958,93 |
| Principality of Asturias | 619,63 | 2153030,07 |
| Balearic Islands | 1616,42 | 1832259,71 |
| Canary Islands | 1083,417 | 1026364,24 |
| Cantabria | 751,341 | 3022600,57 |
| Castile and Leon | 740,72 | 2639087,05 |
| Castilla la Mancha | 787,67 | 1381555,01 |
| Catalonia | 1397,21 | 3665752,14 |
| Valencian Community | 1148,95 | 1906057,44 |
| Estremadura | 611,41 | 3245981,18 |
| Galicia | 684,68 | 2776904,96 |
| Madrid's community | 1464,69 | 1437165,45 |
| Murcia region | 895,92 | 1799597,76 |
| C. Foral of Navarra | 964,96 | 6307036,01 |
| Basque Country | 953,52 | 5157878,33 |
| The Rioja | 624,4 | 2991936,74 |
| C. A. of Ceuta | 1325,05 | 4398592,26 |
| C. A. from Melilla | 1377,14 | 11575708,3 |
Table 28, graphic 42 and 43: Relationship between social work units for each 100.000 inhabitants and crimes for each 100.000 population.
| 2017 | ||
| Crimes | UTS | |
| Andalusia | 997,42 | 10,6565535 |
| Aragon | 723,55 | 2,97994269 |
| Principality of Asturias | 619,63 | 11,0149185 |
| Balearic Islands | 1616,42 | 0,98566397 |
| Canary Islands | 1083,417 | 5,92945092 |
| Cantabria | 751,341 | 20,5068112 |
| Castile and Leon | 740,72 | 16,7779632 |
| Castilla la Mancha | 787,67 | 22,3974749 |
| Catalonia | 1397,21 | 8,35116724 |
| Valencian Community | 1148,95 | 6,61741181 |
| Estremadura | 611,41 | 7,03755834 |
| Galicia | 684,68 | 15,3968909 |
| Madrid's community | 1464,69 | 1,55213069 |
| Murcia region | 895,92 | 9,86211404 |
| The Rioja | 624,4 | 30,1222965 |
| C. A. of Ceuta | 1325,05 | 1,17703834 |
| C.A from Melilla | 1377,14 | 3,48351138 |
- Annexed: Table 17, graphic 18 and 19: Relationship between the aging of the population and crimes for each 100.000 population. ↑
- Annexed: Table 18, graphic 20 and 21: Relationship between the percentage of foreigners and crimes for each 100.000 population. ↑
- Annexed: Table 19, graphic 22 and 23: Relationship between the number of tourists and crimes for each 100.000 population. ↑
- Annexed: Table 20, graphic 24 and 25: Relationship between GDP per capita and crime for each 100.000 population. ↑
- Annexed: Table 21, graphic 26 and 27: Relationship between the average annual income per household and the crimes for each 100.000 population. ↑
- Annexed: Table 22, graphic 28 and 29: Relationship between the at-risk-of-poverty rate and crimes for each 100.000 population. ↑
- Annexed: Table 23, graphic 30 and 31: Relationship between the unemployment rate and crimes for each 100.000 population. ↑
- Annexed: Table 24, graphic 32, 33, 34 and 35: Relationship between the unemployment rate and crimes for each 100.000 population. ↑
- Annexed: Table 25, graphic 36 and 37: Relationship between early school leaving and crimes for each 100.000 population. ↑
- Annexed: Table 26, graphic 38 and 39: Relationship between public spending on education and crimes for each 100.000 population. ↑
- Annexed: Table 27, graphic 40 and 41: Relationship between public spending on education and crimes for each 100.000 population. ↑
- Annexed: Table 28, graphic 42 and 43: Relationship between public spending on education and crimes for each 100.000 population. ↑
- Gould, E.; Mustard, D. & Weinberg, B. (2002). “Crime rates and local labor market opportunities in the United States: 1977-1997.” Rev Econ Stat, pp. 45-61. ↑
- Maxfield, M.G. (1987) “Household composition, routine activity and victimisation: A comparative analysis.” Journal of Quantitative Criminology, pp. 301-320. ↑
- Sharpley, R. (1994). “Tourism, tourists and society” Huntingdon: Elm. ↑
- Alonso-Borrego, C.; Grouper N. & Vazquez P. (2012). “Does Immigration Cause Crime? Evidence from Spain” American Law and Economics Review 14 (1), pp. 165-191. ↑
- Garcia Spain, E. (2019). "More immigration, less crime " Criminal Criticism and Power: publication of the Observatory of the Penal System and Human Rights (18), pp. 194-205. ↑
- Statistics National Institute: National results of adults convicted of crime according to age, 2017. ↑
- Fernandez Molina, E.; Bartolomé Gutiérrez, R.; Alberola stove, C., and Megías Boró, A. (2009). "Evolution and trends of juvenile delinquency in Spain". Spanish Journal of Criminological Research (7), pp. 1-30. ↑
- Pastor Seller, E. (2001). "Social initiative and community social work". Alternatives. Social Work Notebooks. (9), pp. 169-191. ↑
- Ruiz-Morales, M. (2018). "Determining factors of crime in Spain. Study of statistical correlation ". Via Iuris Magazine, pp. 1-41. ↑
- Rodriguez Andres, A. (2003). "The Socio-economic Determinants of Crime in Spain". Spanish Journal of Criminological Research (1): REIC, ISSN 1696-9219, N. 1. ↑