
This analysis is part of the TFG made by Andriana Ivashkiv, for more information go to this link
Analysis performed by Andriana Ivashkiv: https://www.linkedin.com/in/kateryna-andriana-ivashkiv-shulhan-a833ba193/

The analysis of total crimes consists of a study of the average number of crimes and the evolution of crime over time in the autonomous communities in 2017, 2018 and 2019.
CRIMINALITY INDEX OF THE AUTONOMOUS COMMUNITIES
The graphic 1 shows the total mean of crimes for each 100.000 inhabitants of the three years[1], allowing to identify which are the areas of the country with a higher and lower crime rate.
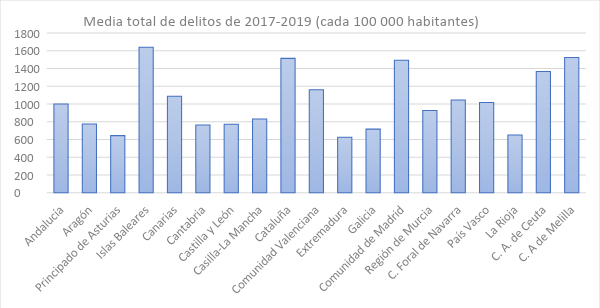
Graphic 1. Own elaboration
To carry out the interpretation of this graph, two statistical terms are going to be introduced that measure the most centric value of a data set; mean and median. The mean is the result of dividing the sum of a set of values by the number of them, and the median is the value that is farthest in the middle of all the data. If they turn out to be two very different figures from each other, it will be more convenient to use one or the other depending on the situation. In this case, the total mean of all communities is 1028,82 crimes for each 100.000 population, and the median is 1000,33. Seeing that both values are similar, the mean will be used as the reference value since it is the most widely used measure of central tendency.
Thus, These are the autonomous communities whose means are above the total average: Balearic Islands (1638,75), Autonomous City of Melilla (1523,8), Catalonia (1513,66), Madrid's community (1493,28), Autonomous City of Ceuta (1366,84), Valencian Community (1159,67), Canary Islands (1087,3) and Foral Community of Navarra (1044,45). On the other hand, these are the territories whose average is below the total average: Basque Country (1016,33), Andalusia (1000,33), Murcia region (926,6) and Castilla La Mancha (831,64), Estremadura (625,77), Principality of Asturias (643,02), The Rioja (650,01), Galicia (716,56), Aragon (774,34), Cantabria (763,65) and Castilla y León (771,63).
It could be said that the autonomous communities with an average higher than the total average have a high crime rate, and communities with a mean lower than the total mean have low crime. However, it is convenient to also speak of a “normal” crime rate in the country. Thus, the data will be interpreted as follows; It is considered that those communities that are approximately 100 below or 100 above average.
So that, by order, the territories with the greatest focus of crime are: Balearic Islands (1638,75), Autonomous City of Melilla (1523,8), Catalonia (1513,66), Madrid's community (1493,28), Autonomous City of Ceuta (1366,84) and Valencian Community (1159,67). On the other hand, areas with medium crime are: Canary Islands (1087,3), Foral Community of Navarra (1044,45), Basque Country (1016,33), Andalusia (1000,33) and Region of Murcia (926,6). Finally, Communities with the lowest crime rate are: Castilla la Mancha (831,64), Aragon (774,34), Castile and Leon (771,63), Cantabria (763,65), Galicia (716,56), The Rioja (650,01), Principality of Asturias (643,02) and Extremadura (625,77).
THE EVOLUTION OF CRIMINALITY OVER TIME
Then, the behavior of the criminal activity will be determined over time. The graphic 2 shows the mean annual crime for each 100.000 inhabitants over the years 2017, 2018 and 2019[2].
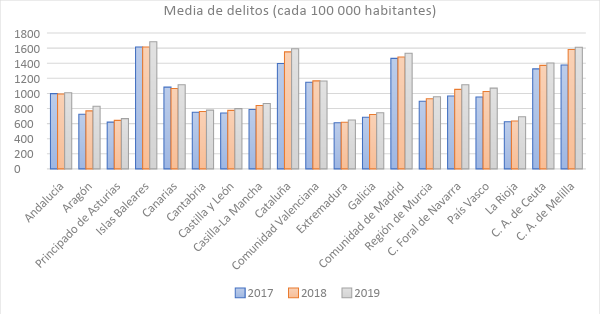
Graphic 2. Own elaboration
At first sight, It is observed that the average of crimes of most communities increases from 2017 a 2018, doing it again in 2019. Thus, it can be said that there has been a general increase in crime in Spain during these years. Following this line, It is interesting to determine which are the territories that have experienced the most notorious growth in crime. For it, the range will be taken into account; a statistical concept that indicates the interval between the maximum value and the minimum value. Once this has been calculated for each autonomous community, it has been verified that the minimum value corresponds to 2017 and the maximum to 2019 (and not the other way around), the highest ranks will determine the autonomous communities with the highest crime rate. In the same way, the ranges closest to 0 determine a stable average crime rate over the three years.
The autonomous communities that have a larger range, with a minimum increase of 100 mean crimes (For each 100.000 population) between 2017 and 2019, son: Autonomous City of Melilla (235,53), Catalonia (195,5), Foral Community of Navarra (149,96), The Rioja (116,38) and Aragon (106, 95). On the other hand, the autonomous communities with the lowest rank, with a maximum increment of up to 50 average crimes for each 100.000 population, son: Andalusia (16,55), Valencian Community (17,42), Cantabria (27,59), Estremadura (36,19) and Principality of Asturias (46,65).
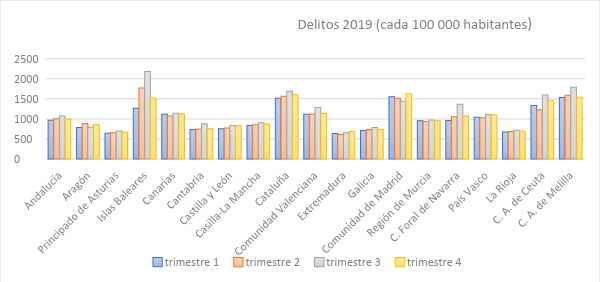
Continuing with the analysis of crime in the timeline, the following three graphs correspond one to each year and show crime according to quarters, indicating the crimes for each 100.000 population[3].
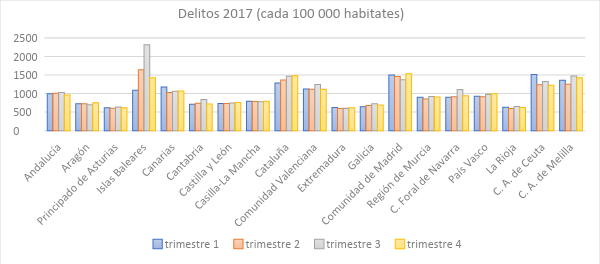
Graphic 3. Own elaboration
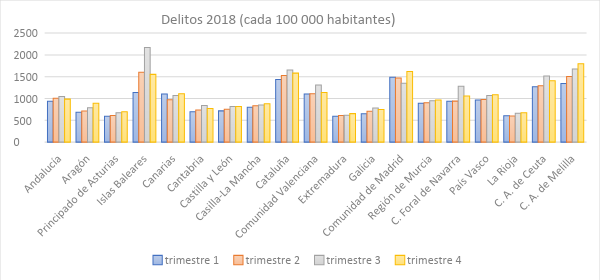
Graphic 4. Own elaboration
Graphic 5. Own elaboration
The graphics 3, 4 and 5 provide relevant information regarding the behavior of crime during the quarters of the years 2017, 2018 and 2019. Naked eye, and contemplated each graph separately, it can be seen that some of the autonomous communities with the highest crime rates are those with the greatest difference between their quarters (Balearic Islands, Catalonia, Valencian Community, Madrid's community, Foral Community of Navarra, Autonomous City of Ceuta and Autonomous City of Melilla). On the contrary, the communities closest to the value "0" maintain greater stability (Principality of Asturias, Castile and Leon, Castilla la Mancha, Estremadura, Galicia and La Rioja).
Looking at the graphs as a whole and more in depth, similarities can be identified with regard to the quarters of each autonomous community. Thus, almost all the territories maintain a similar pattern during the three years with regard to crime for each period of the year, with the exceptions mentioned below.
- Andalusia: the four quarters of the year have a very similar crime rate, which increases slightly during the third trimester. This pattern is maintained throughout the three years.
- Aragon: the four quarters remain at the same level in 2017. In 2018 crime progressively increases from the first to the last trimester and in 2019 crime is changing. This is one of the communities that does not follow a pattern. However, it is remarkable that, during the three years and unlike the rest of the territories, the rate is lower in the third quarter than in the fourth.
- Principality of Asturias: crime is stable, since the four quarters remain at a very similar level throughout the years. This pattern occurs all three years.
- Islas Baleares: the four quarters of the year are very different. The first quarter has the lowest crime rate, which rises notably in the second quarter and reaches its maximum peak in the third. The fourth quarter drops notably. This pattern remains very stable over the three years.
- Canary Islands: the four quarters have a similar crime rate, highlighting a slight reduction in the second quarter. This pattern occurs all three years.
- Cantabria: there is an increase in crime in the third quarter, while the other three remain at the same level. This pattern happens all three years.
- Castile and Leon: the four quarters remain at very similar levels of crime during the four quarters. This pattern occurs every year.
- Castilla la Mancha: the four quarters have very similar crime levels. This pattern appears every year.
- Catalonia: crime increases slightly from first to second trimester, increases again in the third quarter and decreases in the fourth. This pattern is maintained every year.
- Community Valencian: crime increases in the third trimester, but the other three stay at the same level. This pattern is very stable over the three years.
- Estremadura: the four quarters remain at very similar levels throughout all quarters, keeping this pattern every year.
- Galicia: all the quarters have a similar crime rate, with a slight elevation in the third trimester. This pattern is repeated all three years.
- Madrid's community: the first two quarters remain very similar, the third quarter decreases in crime and the fourth quarter increases, reaching its maximum peak. This pattern occurs every year.
- Murcia region: maintains similar crime levels in all its quarters. This pattern occurs every year.
- Foral Community of Navarra: there is a rebound in the third quarter, while the rest remain at similar levels. This pattern happens all three years.
- Basque Country: the first quarter remains at the same crime level as the second, in the third it increases a little, and the third and the fourth stay the same again. This pattern is maintained every year.
- The Rioja: all quarters have very similar crime levels. This pattern is maintained for three years.
- Autonomous City of Ceuta: this is one of the communities that does not have a clear pattern. Each year the peak occurs in a different quarter, and these are disparate from each other.
- Autonomous City of Melilla: this community does not have a clear pattern either. Quarters increase and decrease your crime differently each year.
RESULTS AND CONCLUSIONS OF THE SECTION
First, the areas with the highest and lowest crime rates in Spain have been identified, as well as those that have a normal crime rate. Indicating in parentheses the average of crimes for each 100.000 population, The autonomous communities with the highest crime rate are: Balearic Islands (1638,75), Autonomous City of Melilla (1523,8), Catalonia (1513,66), Madrid's community (1493,28), Autonomous City of Ceuta (1366,84) and Valencian Community (1159,67). On the other hand, Communities with average crime rates are: Canary Islands (1087,3), Foral Community of Navarra (1044,45), Basque Country (1016,33), Andalusia (1000,33) and Region of Murcia (926,6). Finally, The communities with the lowest crime rate in the country are: Castilla la Mancha (831,64), Aragon (774,34), Castile and Leon (771,63), Cantabria (763,65), Galicia (716,56), The Rioja (650,01), Principality of Asturias (643,02) and Extremadura (625,77).
As you can appreciate, the autonomous communities bathed by the Mediterranean Sea present, as usual, more criminality than the interior or northern areas of the country. These areas with the highest crime rates are characterized by a mild climate in winter and high temperatures in summer.. While, the northern or inland areas of Spain have, as usual, a colder winter and a less hot summer. Thus, it is interesting to mention the thermal laws of Quetelet. They postulate that high temperatures excite human passions; the days are longer, people become more irritable, They consume more intoxicating drinks and their social relationships intensify. This can lead to conflicts, quarrels, injuries or even homicides[4].
Secondly, the territories of Spain in which crime has increased the most among 2017 and 2019 son, by order: Autonomous City of Melilla, Catalonia, Foral Community of Navarra, La Rioja and Aragon. On the contrary, the areas that have been more stable over time in terms of crime are, by order: Andalusia, Valencian Community, Cantabria, Extremadura and Principality of Asturias.
In third place, It has been observed that some of the areas with the highest crime rates are those with the most noticeable variation in crime between quarters, as Balearic Islands, Autonomous City of Ceuta, Autonomous City of Melilla, Catalonia, Valencian Community, Community of Madrid and Foral Community of Navarra (highlighting the first three mentioned). On the contrary, areas with less crime are more stable throughout the year: Principality of Asturias, Castile and Leon, Castilla la Mancha, Estremadura, Galicia and La Rioja.
By last, patterns have been identified in 2017, 2018 and 2019 with regard to the amount of crimes that are committed in each period of the year. Each autonomous community maintains a similar pattern of crime per quarter during the three years covered by this study, except the Autonomous City of Ceuta, the Autonomous City of Melilla and, to a lesser extent, Aragon. If the territories of the country that do have a pattern are taken into account, could be classified as follows:
- Communities whose crime rate is very stable during all quarters of the year, as the Principality of Asturias, Castilla Leon, Castilla la Mancha, Estremadura, Region of Murcia and La Rioja.
- Communities with a stable crime rate, although with a slight elevation of the third and fourth trimesters, like the Basque Country.
- Communities whose crime is stable and have a slight increase in crime only in the third quarter, like Andalusia and Galicia.
- Communities with a Notorious Increase in Crime During the Third Quarter, as Balearic Islands, Cantabria, Catalonia, Valencian Community and Foral Community of Navarra.
- Communities where crime decreases in the third quarter, as Community of Madrid and Aragon.
- Communities where crime declines in the second quarter, as Canarias.
When analyzing these results, It is important to note that the third quarter corresponds to the months of July, August and september. These summer months correspond to a time of vacations and leisure time for many of the citizens. Thus, It must be taken into account that there is a significant increase in foreign tourism and the displacement of the population from inland areas to coastal areas. Likewise, it should be taken into account that each autonomous community has different festive seasons, which can also have a relevant influence on criminal activity.
ANNEXES
Table 1, graphic 1 and 2: Average of crimes for each 100.000 population
| Average of crimes for each 100 000 population | ||||
| 2017 | 2018 | 2019 | Total | |
| Andalusia | 997,42 | 993,5 | 1010,05 | 1000,33 |
| Aragon | 723,55 | 768,97 | 830,5 | 774,34 |
| Principality of Asturias | 619,63 | 643,15 | 666,28 | 643,02 |
| Balearic Islands | 1616,42 | 1615,366 | 1684,48 | 1638,75 |
| Canary Islands | 1083,417 | 1064,13 | 1114,35 | 1087,3 |
| Cantabria | 751,341 | 760,69 | 778,94 | 763,65 |
| Castile and Leon | 740,72 | 775,621 | 798,54 | 771,63 |
| Casilla-La Mancha | 787,67 | 840,17 | 867,08 | 831,64 |
| Catalonia | 1397,21 | 1550,6 | 1593,16 | 1513,66 |
| Valencian Community | 1148,95 | 1166,37 | 1163,69 | 1159,67 |
| Estremadura | 611,41 | 618,32 | 647,6 | 625,77 |
| Galicia | 684,68 | 721,46 | 743,54 | 716,56 |
| Madrid's community | 1464,69 | 1482,024 | 1533,12 | 1493,28 |
| Murcia region | 895,92 | 928,18 | 955,7 | 926,6 |
| C. Foral of Navarra | 964,96 | 1053,46 | 1114,92 | 1044,45 |
| Basque Country | 953,52 | 1025,58 | 1069,9 | 1016,33 |
| The Rioja | 624,4 | 634,35 | 691,29 | 650,01 |
| C. A. of Ceuta | 1325,05 | 1372,08 | 1403,38 | 1366,84 |
| C. A. from Melilla | 1377,14 | 1581,6 | 1612,67 | 1523,8 |
Table 2, graphic 3: Crimes for each 100.000 inhabitants and by quarters of 2017
| Crimes for each 100.000 population 2017 | ||||
| t1 | t2 | t3 | t4 | |
| Andalusia | 993,183624 | 1007,84981 | 1028,11278 | 960,569559 |
| Aragon | 725,348615 | 721,986628 | 696,007641 | 750,86915 |
| Principality of Asturias | 616,835433 | 605,14416 | 637,319317 | 619,250986 |
| Balearic Islands | 1090,9508 | 1637,90469 | 2314,07017 | 1422,76113 |
| Canary Islands | 1177,77869 | 1027,45526 | 1060,80249 | 1067,63321 |
| Cantabria | 709,122084 | 741,174747 | 838,366693 | 716,704435 |
| Castile and Leon | 728,666531 | 730,810153 | 747,175881 | 756,245051 |
| Casilla-La Mancha | 792,870613 | 785,732956 | 778,053822 | 794,052018 |
| Catalonia | 1283,80337 | 1363,79458 | 1464,68356 | 1476,59489 |
| Valencian Community | 1119,39491 | 1117,65455 | 1240,87602 | 1117,87715 |
| Estremadura | 626,250093 | 600,229647 | 600,414846 | 618,749537 |
| Galicia | 646,374032 | 678,533965 | 723,506179 | 690,312402 |
| Madrid's community | 1499,81928 | 1456,17521 | 1369,73228 | 1533,05946 |
| Murcia region | 898,948699 | 854,467164 | 920,305277 | 909,967061 |
| C. Foral of Navarra | 899,828056 | 914,597176 | 1108,15038 | 937,294981 |
| Basque Country | 927,645138 | 914,382647 | 977,641537 | 994,413347 |
| The Rioja | 632,885304 | 594,51901 | 648,739144 | 621,470539 |
| C. A. of Ceuta | 1514,84834 | 1239,42137 | 1325,34517 | 1220,58875 |
| C. A. from Melilla | 1357,40827 | 1251,74176 | 1473,52531 | 1425,91732 |
Table 3, graphic 4: Crimes for each 100.000 inhabitants and by quarters of 2018
| Crimes for each 100.000 population 2018 | ||||
| t1 | t2 | t3 | t4 | |
| Andalusia | 934,794681 | 1006,24874 | 1047,1103 | 985,877596 |
| Aragon | 682,341938 | 711,530585 | 789,468858 | 892,546045 |
| Principality of Asturias | 591,007582 | 612,111522 | 675,03433 | 694,484967 |
| Balearic Islands | 1135,25637 | 1604,20513 | 2168,73297 | 1553,27095 |
| Canary Islands | 1105,66179 | 973,076372 | 1066,84025 | 1110,97272 |
| Cantabria | 694,208666 | 736,433374 | 839,49613 | 772,62598 |
| Castile and Leon | 716,472602 | 751,256452 | 816,216746 | 818,541204 |
| Casilla-La Mancha | 798,596018 | 832,39302 | 850,105609 | 879,610145 |
| Catalonia | 1437,9877 | 1529,19745 | 1653,34112 | 1581,90752 |
| Valencian Community | 1105,74706 | 1111,26713 | 1309,86886 | 1138,60559 |
| Estremadura | 593,552019 | 610,609183 | 615,735653 | 653,391906 |
| Galicia | 648,137147 | 706,358821 | 782,753948 | 748,62783 |
| Madrid's community | 1486,437 | 1470,96136 | 1352,52252 | 1618,17759 |
| Murcia region | 890,085891 | 904,086482 | 950,349305 | 968,205131 |
| C. Foral of Navarra | 937,064708 | 939,998826 | 1280,51097 | 1056,28256 |
| Basque Country | 967,810292 | 979,178641 | 1067,30608 | 1088,04195 |
| The Rioja | 606,003009 | 596,499564 | 663,340461 | 671,57678 |
| C. A. of Ceuta | 1269,61383 | 1294,27793 | 1515,08033 | 1409,37706 |
| C. A. from Melilla | 1343,99889 | 1506,06594 | 1678,55158 | 1797,78663 |
Table 4, graphic 5: Crimes for each 100.000 inhabitants and by quarters of 2019
| Crimes for each 100.000 population 2019 | ||||
| t1 | t2 | t3 | t4 | |
| Andalusia | 968,12071 | 1001,10052 | 1070,41159 | 1000,58948 |
| Aragon | 788,681193 | 885,399809 | 793,835477 | 854,095116 |
| Principality of Asturias | 641,767697 | 657,60657 | 697,692609 | 668,068048 |
| Balearic Islands | 1268,42169 | 1768,91758 | 2180,15416 | 1520,45308 |
| Canary Islands | 1118,46954 | 1071,00946 | 1143,0819 | 1124,87804 |
| Cantabria | 736,906233 | 746,543493 | 879,055824 | 753,255157 |
| Castile and Leon | 755,809011 | 772,770538 | 838,616273 | 826,989083 |
| Casilla-La Mancha | 835,619518 | 851,606822 | 906,160425 | 874,972883 |
| Catalonia | 1517,247 | 1567,62994 | 1688,04348 | 1599,7463 |
| Valencian Community | 1117,19786 | 1121,19484 | 1283,2327 | 1133,16582 |
| Estremadura | 636,502421 | 611,870264 | 654,672149 | 687,358927 |
| Galicia | 714,058423 | 733,06195 | 788,961211 | 738,099922 |
| Madrid's community | 1549,79579 | 1514,90367 | 1441,12745 | 1626,66353 |
| Murcia region | 956,624883 | 937,011764 | 974,430651 | 954,750592 |
| C. Foral of Navarra | 962,376226 | 1054,39505 | 1367,44246 | 1075,48906 |
| Basque Country | 1039,86999 | 1030,31286 | 1112,88464 | 1096,53334 |
| The Rioja | 671,090095 | 684,663413 | 718,754538 | 690,660926 |
| C. A. of Ceuta | 1336,44739 | 1230,28652 | 1597,1313 | 1449,68565 |
| C. A. from Melilla | 1532,02215 | 1592,1468 | 1788,70813 | 1537,80337 |
- Annexed: Table 1, graphic 1 and 2: Average of crimes for each 100.000 population ↑
- Annexed: Table 1, graphic 1 and 2: Average of crimes for each 100.000 population. ↑
- Annexed: Table 2, graphic 3: Crimes for each 100.000 inhabitants and by quarters of 2017.: Table 3, graphic 4: Crimes for each 100.000 inhabitants and by quarters of 2018.: Table 4, graphic 5: Crimes for each 100.000 inhabitants and by quarters of 2019. ↑
- Quetelet, A (1848). “Of the social system and the laws which govern it”. Paris: Guillaumin and Orellana Wiarco, THE. A. (2007). Criminology Handbook (11ª ed.). Mexico: Editorial Porrúa. ↑