
This analysis is part of the TFG made by Andriana Ivashkiv, for more information go to this link
Analysis performed by Andriana Ivashkiv: https://www.linkedin.com/in/kateryna-andriana-ivashkiv-shulhan-a833ba193/

ANALYSIS OF THE TYPES OF CRIME
The analysis of the crime typologies consists of an interpretation of the graphs with the data relative to the means for each 100.000 inhabitants of twelve different criminal typologies during 2017, 2018 and 2019. To determine which communities are around an average in terms of the amount of a crime type, a rule of three will be used following the process in the previous section; with an average of 1000, the values of 100 above or below are within the mean. So that, if the mean is 100, the values that are 10 above or 10 below they will fall within the mean.
In this way, values that are above the mean will have a high index, those that are within the mean will have a normal one, and those that are below will have a low index of a specific criminal typology. It should be mentioned that the mean or median will be used as is more convenient in each case. If you want to see the process carried out to calculate the means and medians, go to the annex indicated in each section.
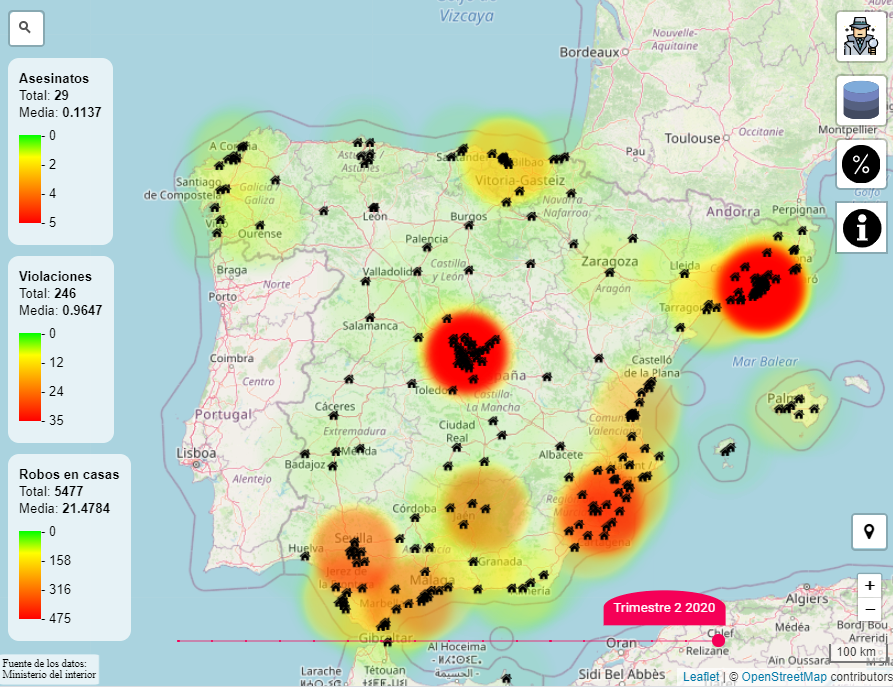
To observe the types of crime graphically, you can use the map created by Angel Langdon
Link to the map: entredatos.es/mapa/crimen/espana/
Murders
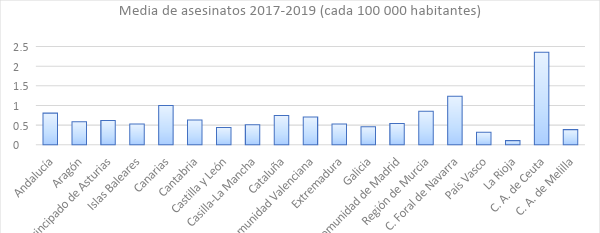
The murders refer to both intentional homicides and murders, and the Penal Code (1995) collects it in book II, title I; of homicide and its forms[1]. The total average of the three years of all the autonomous communities is 0,70 murders for every 100.000 population, while the median is 0,58.
Graphic 6. Own elaboration
As you can see, The Autonomous City of Ceuta far exceeds the rest of the communities with an average of 2,35 murders for every 100.000 population. As a result, this raises the average and does not reflect actual criminal activity in the country. Thus, in this case it is more convenient to use the median than the mean as a reference value. Also, as the median is 0,5, those values that are 0,05 above or below will fall within the normal crime rate.
In this way, territories with a high murder rate are: Autonomous City of Ceuta (2,35), Foral Community of Navarra (1,23), Canary Islands (1), Murcia region (0,85), Andalusia (0,80), Catalonia (0,74) and Valencian Community (0,7). The territories whose rate is within the average are: Cantabria (0,63), Principality of Asturias (0,61), Aragon (0,58), Madrid's community (0,54), Balearic Islands (0,53) and Extremadura (0.53). Finally, communities with the low murder rate are: Castilla la Mancha (0,50), Castile and Leon (0,44), Galicia (0,45), Basque Country (0,31), The Rioja (0,1) and Autonomous City of Melilla (0,38).
ASSASSINATION ATTEMPTS
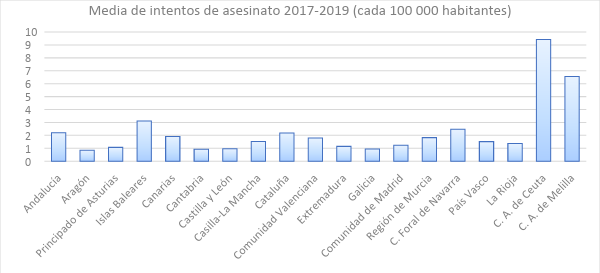
The assassination attempts refer to the crimes of intentional homicides and murder in an attempted degree, and the Penal Code (1995) collects it in book II, title I; of homicide and its forms[2]. The total average for the whole of Spain between 2017 and 2019 It is 2,26 For each 100.000 population, while the median is 1,52.
Graphic 7. Own elaboration
These values are different because, as with the completed murders, the Autonomous Cities of Ceuta and Melilla far exceed the rest of the communities (half of 9,42 and 6,56 assassination attempts for every 100.000 population). Thus, it is more appropriate to use the median as a reference value. Also, the territories that are 0,15 above or below this will be included within the average.
So, Communities whose average number of assassination attempts is above the total median are: Autonomous City of Ceuta (9,42), Autonomous City of Melilla (6,56), Balearic Islands (3,11), Foral Community of Navarra (2,47), Andalusia (2,2), Catalonia (2,18), Canary Islands (1,9), Murcia region (1,82) and Valencian Community (1,78). The areas that fall within the crime rate are: Castilla la Mancha (1,52), Basque Country (1,51) and La Rioja (1,37). By last, Communities that have a lower murder attempt rate than the rest are: Madrid's community (1,22), Estremadura (1,14), Principality of Asturias (1,06), Castile and Leon (0,95), Galicia (0,94), Cantabria (0,91) and Aragon (0,83).
Fights
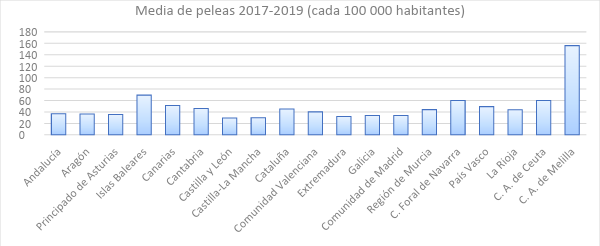
Fights are serious crimes and less serious than injuries and riotous brawl, and the Penal Code (1995) collects it in book II, Page 22; Crimes against public order[3]. The total mean is 49,12 For each 100.000 population, and the median is 43,78.
Graphic 8. Own elaboration
As in the other sections, fights in the Autonomous City of Ceuta are more numerous than in the rest of the country (half of 155,96 fights for each 100.000 population). Thus, the median will continue to be used as a reference. Also, the value to be added and subtracted to determine if a community is within or outside the average is that of 4,3.
Thus, the areas of the country with the highest rate of fights are: Autonomous City of Melilla (155,96), Autonomous City of Ceuta (60,02), Balearic Islands (69,44), Foral Community of Navarra (60,04), Canary Islands (51,13) and Basque Country (49,33). Then, Communities with an average fight rate are: Cantabria (46,22), Catalonia (44,99), Murcia region (44,09), The Rioja (43,78) and Valencian Community (40,15). Finally, the areas with the lowest fight rate are: Andalusia (36,95), Aragon (36,33), Principality of Asturias (35,69), Madrid's community (33,87), Galicia (33,78), Estremadura (32,19), Castilla la Mancha (29,99) and Castilla y León (29,27).
Abductions
Kidnappings refer to the crime that its name indicates, and the Penal Code (1995) collects it in book II, title VI; crimes against freedom[4]. The average of the whole country during 2017, 2018 and 2019 It is 0,17 For each 100.000 population, while the median is 0,1.
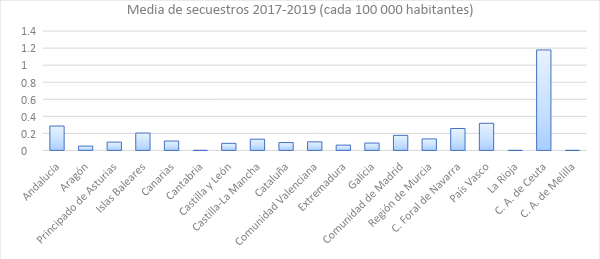
Graphic 9. Own elaboration
The Autonomous City of Ceuta has a higher average than the rest of the communities (1,17 kidnappings for each 100.000 population), so the median will be used as the reference value. Likewise, all those figures that are 0,01 above or below the average will be included in the average.
In this way, Communities with a kidnapping rate that is above average are: Autonomous City of Ceuta (1,17), Basque Country (0,31), Andalusia (0,28), Foral Community of Navarra (0,25), Balearic Islands (0,20), Madrid's community (0,17), Murcia region (0,13) and Castilla-La Mancha (0,13). The areas of the country with an average kidnapping rate are: Canary Islands (0,11), Valencian Community (0,10), Principality of Asturias (0,09) and Catalonia (0,09). To end the kidnappings, The communities with the lowest rate of this type of crime are: Aragon (0,05), Estremadura (0,06), Castile and Leon (0,08), Galicia (0,08), Autonomous City of Melilla (0), The Rioja (0) and Cantabria (0).
SEXUAL ASSAULT WITH PENETRATION
Penetrating sexual assaults refer to the crime that the name itself indicates, and the Penal Code (1995) collects it in book II, title VIII; crimes against sexual freedom and indemnity[5]. The total mean is 3,18, while the median is 2,69.
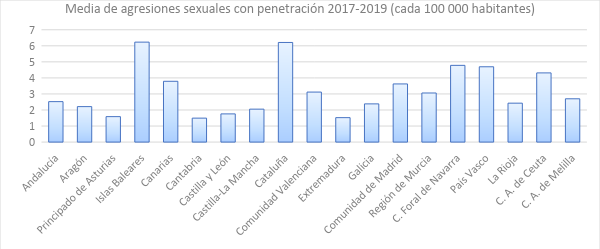
Graphic 10. Own elaboration
As you can see, there is a dispersion of the data in general, although this time it is not due to the figures of the Autonomous City of Ceuta or Melilla. Thus, the median will continue to be used as a measure, while the value that is going to be added and subtracted to determine which territories are within the average is going to be 0,26.
So that, The autonomous communities with the highest rate of penetrative sexual assaults in the country are: Balearic Islands (6,22), Catalonia (6,2), Foral Community of Navarra (4,78), Basque Country (4,69), Autonomous City of Ceuta (4,31), Canary Islands (3,78), Madrid's community (3,62), Valencian Community (3,11) and Region of Murcia (3,05). The areas of Spain with an average attack rate are: Autonomous City of Melilla (2,69), Andalusia (2,52) and La Rioja (2,42). Finally, Communities with a low rate of this type of sexual assault are: Galicia (2,38), Aragon (2,21), Castilla la Mancha (2,05), Castile and Leon (1,75), Principality of Asturias (1,58), Estremadura (1,52) and Cantabria (1,49).
SEXUAL ASSAULT WITHOUT PENETRATION
Non-penetrative sexual assaults appear in the Penal Code (1995) collects it in book II, title VIII; crimes against sexual freedom and indemnity[6]. The total mean is 25,42 For each 100.000 population, while the median is 24,99.
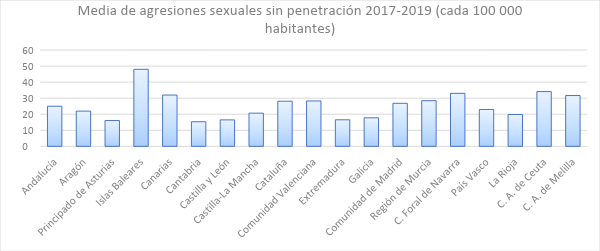
Graphic 11. Own elaboration
Mean and median are similar because, as can be seen in the graph, communities have more balanced data with each other. So that, the 25 as measurement value, while the figure that is going to be added and subtracted to determine if a community is part of the average is that of 2,5.
Therefore, the territories with the highest rate of sexual assaults (no penetration) according to their average they are: Balearic Islands (48), Autonomous City of Ceuta (34,11), Foral Community of Navarra (33,01), Canary Islands (31,96), Autonomous City of Melilla (31,66), Murcia region (28,45), Valencian Community (28,27) and Catalonia (28,1). Communities with an attack rate that falls within the average are: Andalusia (24,99) and Community of Madrid (26,8). To end sexual assaults, the territories of the country with the lowest rate of this type of crime are: Basque Country (22,9), Aragon (21,94), Castilla la Mancha (20,66), The Rioja (19,82), Galicia (17,78), Estremadura (16,52), Castile and Leon (16,48), Principality of Asturias (16,11), and Cantabria (15,33).
THEFT WITH VIOLENCE
Robberies with violence refer to all those robberies that have been committed using violence and intimidation, and the Penal Code (1995) collects it in book II, title XIII; crimes against heritage and socioeconomic order[7]. The total mean is 107,21, while the median is 70,89.
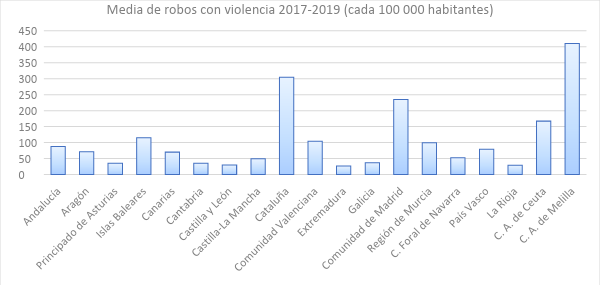
Graphic 12. Own elaboration
The mean and the median are very different because there are a few very high figures and others very low. Because of this, the median is used as a reference value. Also, to this we are going to add and subtract the amount of 7 to indicate the communities that fall within the average for Spain.
So that, the areas of Spain with a high rate of robbery with violence are: Autonomous City of Melilla (410,04), Catalonia (304,51), Madrid's community (234,97), Autonomous City of Ceuta (167,13), Balearic Islands (115,04), Valencian Community (103,96), Murcia region (99,72), Andalusia (88,03) and Basque Country (79,1). The communities that are in the average of robberies are: Aragon (70,89) and the Canary Islands (70,05). Finally, the territories with the lowest rate are: Foral Community of Navarra (52,37), Castilla la Mancha (48,92), Galicia (36,49), Cantabria (35,54), Principality of Asturias (35,48), Castile and Leon (29,69), The Rioja (28,69) and Extremadura (26,36).
THEFT IN HOUSES
Thefts in dwellings refer to the crimes of robbery with force in homes, establishments and other facilities, and the Penal Code (1995) collects it in book II, title X; crimes against privacy, the right to one's own image and the inviolability of the home[8]. The average for the whole of Spain in the years indicated is 265,62 For each 100.000 population, while the median is 233,68.
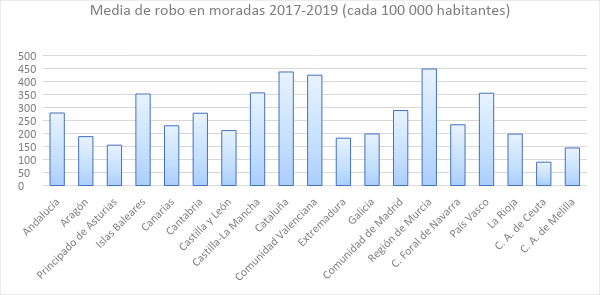
Graphic 13. Own elaboration
Because there is a notable difference between the two, the median will be used as the central measure. Likewise, this value is going to add and subtract the figure of 23,3 to observe which territories are part of the country's average.
In this way, the autonomous communities that, according to your average, have a higher rate of burglary in dwellings are: Murcia region (448,02), Catalonia (436,51), Valencian Community (424,22), Castilla la Mancha (356,18), Basque Country (354,87), Balearic Islands (351,89), Madrid's community (288,17), Andalusia (278,84) and Cantabria (277,96). The areas of the country that are within the average are: Foral Community of Navarra (233,58), Canary Islands (229,78) and Castilla y León (211,33). Finally, The communities with the lowest rate of robberies in homes and other establishments are: Galicia (198,25), The Rioja (197,85), Aragon (188,02), Estremadura (182,02), Principality of Asturias (155,12), Autonomous City of Melilla (144,43) and Autonomous City of Ceuta (89,82).
THEFT IN HOUSES
Burglaries, unlike the previous paragraph, only includes crimes related to robberies with force in homes, and the Penal Code (1995) collects it in book II, title X; crimes against privacy, the right to one's own image and the inviolability of the home[9]. The total mean for each 100.000 inhabitants throughout the country is 184,06, and the median is 156,91.
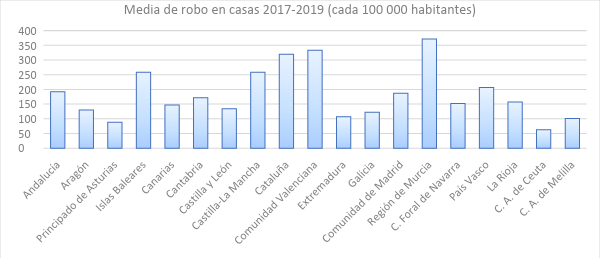
Graphic 14. Own elaboration
As you can see, there is a general dispersion of the data, so the median will be used as the reference value. In the meantime, the figure to be added and subtracted from the median to determine which territories are within the mean is going to be 15,6.
In this way, The autonomous communities with the highest rate of home robberies in the country are: Murcia region (371,16), Valencian Community (332,88), Catalonia (319,98), Balearic Islands (258,59), Castilla la Mancha (258,57), Basque Country (206,13), Andalusia (191,99) and Community of Madrid (186,62). The areas of Spain that are within the average are: Cantabria (171,21), The Rioja (156,91), Foral Community of Navarra (151,55) and the Canary Islands (147,10). To end, Communities with a low home burglary rate are: Castile and Leon (133,72), Galicia (122,25), Aragon (129,62), Estremadura (107,26), Autonomous City of Melilla (100,79), Principality of Asturias (88,55) and Autonomous City of Ceuta (62,36).
HURTOS
They appear in the Penal Code (1995) in book II, title XIII; crimes against heritage and socioeconomic order[10]. The total average for the country is 1213,96, while the median is 1016,43.
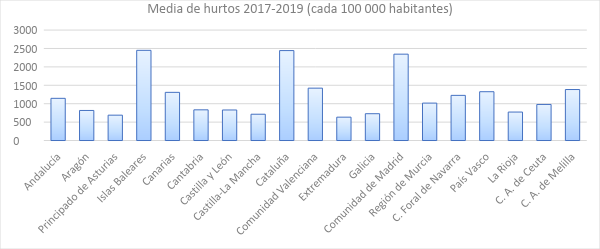
Graphic 15. Own elaboration
As in previous sections, this difference between both values is due to the dispersion of the data. Thus, the median is to be used as the central measure, to which will be added and subtracted the figure of 101,64 to identify which communities fall within the average number of thefts in Spain.
Therefore, the territories with a higher theft rate according to their average are: Balearic Islands (2449,51), Catalonia (2442,63), Madrid's community (2345,55), Valencian Community (1422,62), Autonomous City of Melilla (1384,94), Basque Country (1325,52), Canary Islands (1308,42), Foral Community of Navarra (1226,30) and Andalusia (1145,64). Communities with a theft rate within the average for the country are: Murcia region (1016,43) and Autonomous City of Ceuta (979,64). To end the thefts, the territories with the lowest index are: Cantabria (833,59), Castile and Leon (829,39), Aragon (816,63), The Rioja (773,03), Galicia (728,08), Castilla la Mancha (714,28), Principality of Asturias (688,77) and Extremadura (634,20).
VEHICLE SUBSTRACTIONS
Vehicle thefts appear in the Penal Code (1995) in book II, title XIII; crimes against heritage and socioeconomic order[11]. The average for each 100.000 inhabitants in Spain is 70,01, while the median is 41,17.
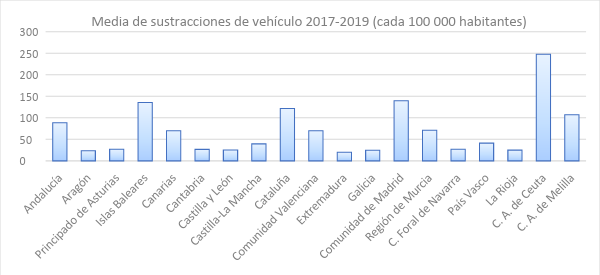
Graphic 16. Own elaboration
It can be seen that the data is scattered, being mostly very high or very low figures. Thus, the median will be used as the reference value, to which we are going to add and subtract the number of 4,1 to indicate which territories of the country are within the mean.
In this way, the territories with the highest rate of vehicle thefts are: Autonomous City of Ceuta (247,89), Madrid's community (139,48), Balearic Islands (135,65), Catalonia (121,57), Autonomous City of Melilla (106,98), Andalusia (88,31), Valencian Community (70,11), Murcia region (71,08) and the Canary Islands (69,87). Communities that are within the mean when it comes to this crime are: Foral Community of the Basque Country (41,17) and Castilla-La Mancha (39,44). Finally, The territories with the lowest rate of vehicle thefts are: Foral Community of Navarra (27,08), Principality of Asturias (27,02), Cantabria (26,70), Castile and Leon (25,20), The Rioja (24,90), Galicia (24,46), Aragon (23,48) and Extremadura (19,86).
DRUG TRAFFIC
Drug trafficking appears in the Penal Code (1995) collects it in book II, title XVII; of crimes against collective security[12]. The average in Spain is 40,80 crimes for each 100.000 population, while the median is 24,22.
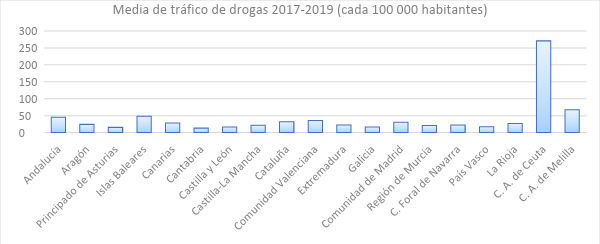
Graphic 17. Own elaboration
As you can see, the Autonomous City of Ceuta notably surpasses the rest of the communities. Because this raises the mean so much, median will be used as reference value. Also, will be added and subtracted by the figure of 2,4 to determine which territories are off or on average.
The communities with the highest average crime for drug trafficking are: Autonomous City of Ceuta (270,82), Autonomous City of Melilla (67,57), Balearic Islands (48,33), Andalusia (45,36), Valencian Community (35,64), Catalonia (32,07), Madrid's community (30,27), Canary Islands (28,11) and La Rioja (27,10). The areas of the country that are in the middle are: Aragon (24,22), Estremadura (22,71), Foral Community of Navarra (22,25) and Castilla-La Mancha (21,75). Finally, Communities with a low rate of drug trafficking are: Murcia region (21,05), Basque Country (16,96), Castile and Leon (16,31), Galicia (16,18), Principality of Asturias (15,37), and Cantabria (13,20).
RESULTS AND CONCLUSIONS OF THE SECTION
Then, The information obtained from the crime averages will be ordered and grouped for each 100.000 inhabitants to facilitate their interpretation. Thus, crime rates can be observed (alto, medium or low) who has each type of crime in a territory of Spain. In this aspect, It is important to emphasize that the rate of a crime has been determined with respect to the means of the same crime in other communities, and not with respect to the means of other crimes in the same community. On the other hand, It will also be determined if the community is part of any of the first three (nº1, 2 The 3) or last three (nº17, 18 The 19) positions in some criminal type, indicating if you have one of the highest or lowest means of any of the crimes seen.
- Andalusia: position no. 3 in kidnappings.
- High index: murders, assassination attempts, kidnappings, robbery with violence, robbery in dwellings, home robbery, thefts, vehicle theft and drug trafficking.
- Average index: penetrative sexual assaults and non-penetrative sexual assaults.
- Low index: fights.
- Aragon: position no. 19 in assassination attempts and no. 18 in vehicle thefts.
- Average index: murders, robbery with violence and drug trafficking.
- Low index: assassination attempts, fights, kidnappings, penetrative sexual assault, non-penetrative sexual assault, burglaries, house robberies, theft and theft of vehicles.
- Principality of Asturias: position no. 17 in sexual assault with penetration and robberies in dwellings and no. 18 in sexual assault without penetration, house robberies, theft and drug trafficking.
- Average index: murders and kidnappings.
- Low index: assassination attempts, fights, penetrative sexual assault, non-penetrative sexual assault, robbery with violence, burglaries, house robberies, thefts, vehicle theft and drug trafficking.
- Islas Baleares: position no. 1 in sexual assault with and without penetration and theft. Position no. 3 in assassination attempts, fights, vehicle thefts and drug trafficking.
- High index: assassination attempts, fights, kidnappings, penetrative sexual assault, non-penetrative sexual assault, robbery with violence, burglaries, house robberies, thefts, vehicle theft and drug trafficking.
- Average index: murders.
- Canary Islands: position no. 3 in murders.
- High index: murders, assassination attempts, fights, penetrative sexual assault, non-penetrative sexual assault, thefts, vehicle theft and drug trafficking.
- Average index: kidnappings, robbery with violence, burglary and burglary
- Cantabria: position no. 18 in murders and no. 19 in kidnappings, sexual assault with and without penetration and drug trafficking.
- High index: burglaries.
- Average index: murders, fights, house robberies.
- Low index: assassination attempts, kidnappings, penetrative sexual assault, non-penetrative sexual assault, robbery with violence, thefts, vehicle theft and drug trafficking.
- Castile and Leon: position no. 17 in sexual assault without penetration and robbery with violence and position nº 19 in fights.
- Average index: burglaries.
- Low index: murders, assassination attempts, fights, kidnappings, penetrative sexual assault, non-penetrative sexual assault, robbery with violence, house robberies, thefts, vehicle theft and drug trafficking.
- Castilla la Mancha: position no. 17 in thefts and number 18 in fights.
- High index: kidnappings, burglaries and burglaries.
- Average index: assassination attempts, vehicle thefts and drug trafficking.
- Low index: murders, fights, penetrative sexual assault, non-penetrative sexual assault, robbery with violence and theft.
- Catalonia: position no. 2 in penetrative sexual assault, robbery with violence, burglaries and thefts. Position no. 3 in burglaries.
- High index: murders, assassination attempts, penetrative sexual assault, non-penetrative sexual assault, robbery with violence, burglaries, house robberies, thefts, vehicle theft and drug trafficking.
- Average index: fights and kidnappings.
- Community Valencian: position no. 2 in burglaries and no. 3 in robberies in dwellings.
- High index: murders, assassination attempts, penetrative sexual assault, non-penetrative sexual assault, robbery with violence, burglaries, house robberies, thefts, vehicle theft and drug trafficking.
- Average index: fights and kidnappings.
- Estremadura: position no. 17 in fights, nº 18 in sexual assault with penetration and no. 19 in robberies with violence, thefts and thefts of vehicles.
- Average index: murders and drug trafficking.
- Low index: assassination attempts, fights, kidnappings, penetrative sexual assault, non-penetrative sexual assault, robbery with violence, burglaries, house robberies, theft and theft of vehicles.
- Galicia: position no. 17 in assassination attempts, vehicle thefts and drug trafficking.
- Low index: murders, assassination attempts, fights, kidnappings, penetrative sexual assault, non-penetrative sexual assault, robbery with violence, burglaries, house robberies, thefts, vehicle theft and drug trafficking.
- Madrid's community: position no. 2 in vehicle thefts and no. 3 in robberies with violence and theft.
- High index: kidnappings, penetrative sexual assault, robbery with violence, burglaries, house robberies, thefts, vehicle theft and drug trafficking.
- Average index: murders and sexual assault without penetration.
- Low index: assassination attempts and fights.
- Murcia region: position no. 1 in burglaries and burglaries.
- High index: murders, assassination attempts, kidnappings, penetrative sexual assault, non-penetrative sexual assault, robbery with violence, burglaries, burglaries and vehicle theft.
- Average index: fights and thefts.
- Low index: drug traffic.
- Foral Community of Navarra: position no. 2 in murders and no. 3 in sexual assaults with and without penetration.
- High index: murders, assassination attempts, fights, kidnappings, penetrative sexual assault, non-penetrative sexual assault and theft.
- Average index: burglaries, burglaries and drug trafficking.
- Low index: robbery and theft of vehicles.
- Basque Country: position no. 2 in kidnappings and number 17 in murders.
- High index: fights, kidnappings, penetrative sexual assault, robbery with violence, burglaries, burglaries and thefts.
- Average index: attempted murder and carjacking.
- Low index: murders, non-penetrative sexual assault and drug trafficking.
- The Rioja: position no. 18 in kidnappings and robberies with violence and no. 19 in murders.
- High index: drug traffic.
- Average index: assassination attempts, fights, penetrative sexual assault and home burglary.
- Low index: murders, kidnappings, non-penetrative sexual assault, robbery with violence, burglaries, theft and theft of vehicles.
- Autonomous City of Ceuta: position no. 1 in murders, assassination attempts, kidnappings, vehicle thefts and drug trafficking. Position no. 2 in fights and sexual assault without penetration. Position no. 19 in burglaries and burglaries.
- High index: murders, assassination attempts, fights, kidnappings, penetrative sexual assault, non-penetrative sexual assault, robbery with violence, vehicle theft and drug trafficking.
- Average index: thefts.
- Low index: burglaries and burglaries.
- Autonomous City of Melilla: position no. 1 in fights and robberies with violence, nº 2 in assassination attempts and drug trafficking, nº 17 in kidnappings and house robberies, nº 18 in murders and robberies in dwellings.
- High index: assassination attempts, fights, non-penetrative sexual assault, robbery with violence, thefts, vehicle theft and drug trafficking.
- Average index: penetrative sexual assault
- Low index: murders, kidnappings, burglaries and burglaries.
Regarding the position occupied by the autonomous communities in some criminal typology, it can be seen that a consistency is maintained; the territories that occupy the first positions, as usual, have a higher crime rate. Unlike, those in the bottom ranks have a lower crime rate. Also, It can be added that they are either part of one of the first three positions or one of the last three. That is to say, if the Region of Murcia is the community with the most robberies in houses and dwellings in the country, It will not be the one with the least fights (for example).
However, this does not apply to the Autonomous City of Ceuta, the Autonomous City of Melilla or the Basque Country. These territories are the only ones that occupy either one of the first three or one of the last three in any type of crime.. For example, the Basque Country stands out with one of the highest averages in kidnappings, but one of the lowest in murders. However, those that differ the most are the Autonomous Cities of Ceuta and Melilla. These rank highest in various types of crime (especially the C. A. of Ceuta), but both have the lowest ranks when it comes to burglaries and home burglaries, being the Region of Murcia, the Valencian Community and Catalonia the communities that are positioned first.
The fact of being both one of the regions that has the most crimes of one type and one of those that has the least of another type, coincides with the observation made in the previous section; the Autonomous City of Ceuta and Melilla are very inconsistent and disparate territories in terms of the information they provide on crime. However, It is not surprising that they have a behavior that differs from the rest of the communities in Spain, because its peculiarities are quite known (both geographical and social and economic). Thus, and due to the administrative need to incorporate these territories into a regional list, notable differences can be observed in the statistics with respect to the rest of the country's regions[13].
In this way, all the areas positioned in the first positions of some type of crime belong to the communities with a high and medium total crime rate: Andalusia, Balearic Islands, Canary Islands, Catalonia, Valencian Community, Madrid's community, Region of Murcia and the Foral Community of Navarra. In these territories you can find types of crime with high rates, medium and low in all communities except the Balearic Islands, Canary Islands, Catalonia and Valencian Community, that are only high and medium. On the other hand, communities that only occupy the last positions in some type of crime have a low total crime rate: Aragon, Principality of Asturias, Cantabria, Castile and Leon, Castilla la Mancha, Estremadura, Galicia and La Rioja. In this case, communities have a combination of high rates, medium and low. However, the Principality of Asturias, Castilla y León and Extremadura have only medium and low rates, while Galicia only low. Finally there would be the Autonomous City of Ceuta, the Autonomous City of Melilla and the Basque Country. The first two territories of the country have a high crime rate, while the Basque Country is positioned with a medium crime rate.
ANNEXES
Table 5, graphic 6: Murders for every 100.000 population
| KILLS FOR EVERY 100.000 POPULATION | ||||
| 2017 | 2018 | 2019 | Total mean | |
| Andalusia | 0,58474 | 0,85874 | 0,97454 | 0,80600667 |
| Aragon | 0,61127 | 0,68769 | 0,45479 | 0,58458333 |
| Principality of Asturias | 0,48311 | 0,68077 | 0,6844 | 0,61609333 |
| Balearic Islands | 0,35842 | 0,70865 | 0,52198 | 0,52968333 |
| Canary Islands | 0,94871 | 1,12799 | 0,92877 | 1,00182333 |
| Cantabria | 0,51698 | 0,34469 | 1,03256 | 0,63141 |
| Castile and Leon | 0,53591 | 0,45659 | 0,3334 | 0,44196667 |
| Castilla la Mancha | 0,5907 | 0,39471 | 0,54111 | 0,50884 |
| Catalonia | 0,86026 | 0,5921 | 0,78174 | 0,7447 |
| Valencian Community | 0,82971 | 0,50366 | 0,77941 | 0,70426 |
| Estremadura | 0,7408 | 0,37283 | 0,46829 | 0,52730667 |
| Galicia | 0,48 | 0,29611 | 0,5927 | 0,45627 |
| Madrid's community | 0,59934 | 0,54727 | 0,48024 | 0,54228333 |
| Murcia region | 0,9522 | 0,74399 | 0,87021 | 0,85546667 |
| C. Foral of Navarra | 1,24372 | 1,6987 | 0,76428 | 1,23556667 |
| Basque Country | 0,22788 | 0,27284 | 0,45294 | 0,31788667 |
| The Rioja | 0 | 0,31678 | 0 | 0,10559333 |
| C. A. of Ceuta | 1,17704 | 1,17448 | 4,71826 | 2,35659333 |
| C. A. from Melilla | 0 | 0 | 1,15624 | 0,38541333 |
Table 6, graphic 7: Kill attempts for every 100.000 population
| MURDER ATTEMPTS EVERY 100.000 POPULATION | ||||
| 2017 | 2018 | 2019 | Total mean | |
| Andalusia | 2,47022 | 2,26611 | 1,87777 | 2,2047 |
| Aragon | 1,14613 | 0,61128 | 0,75798 | 0,83846333 |
| Principality of Asturias | 1,06284 | 1,06978 | 1,07548 | 1,06936667 |
| Balearic Islands | 2,50896 | 3,18892 | 3,65389 | 3,11725667 |
| Canary Islands | 1,70768 | 1,92698 | 2,08973 | 1,90813 |
| Cantabria | 0,6893 | 0,51704 | 1,54885 | 0,91839667 |
| Castile and Leon | 0,7008 | 0,95469 | 1,20856 | 0,95468333 |
| Castilla la Mancha | 1,67366 | 1,43082 | 1,47575 | 1,52674333 |
| Catalonia | 1,90581 | 2,21051 | 2,44944 | 2,18858667 |
| Valencian Community | 1,31539 | 1,8736 | 2,17836 | 1,78911667 |
| Estremadura | 1,48159 | 1,21171 | 0,74927 | 1,14752333 |
| Galicia | 0,99692 | 0,92533 | 0,9261 | 0,94945 |
| Madrid's community | 1,32162 | 1,18576 | 1,17057 | 1,22598333 |
| Murcia region | 2,10845 | 1,69089 | 1,67347 | 1,82427 |
| C. Foral of Navarra | 3,26475 | 2,16198 | 1,98712 | 2,47128333 |
| Basque Country | 1,64072 | 1,68252 | 1,22295 | 1,51539667 |
| The Rioja | 1,90246 | 0,63356 | 1,57829 | 1,37143667 |
| C. A. of Ceuta | 8,23927 | 1,17448 | 18,87304 | 9,42893 |
| C. A. from Melilla | 9,28936 | 1,15762 | 9,24995 | 6,56564333 |
Table 7, graphic 8: You fight for every 100.000 population
| FIGHT EVERY 100 000 POPULATION | ||||
| 2017 | 2018 | 2019 | Total mean | |
| Andalusia | 34,96495 | 34,79077 | 41,10888 | 36,9548667 |
| Aragon | 29,79943 | 37,44094 | 41,76486 | 36,3350767 |
| Principality of Asturias | 31,69205 | 36,08093 | 39,30387 | 35,6922833 |
| Balearic Islands | 63,1721 | 70,95352 | 74,20876 | 69,4447933 |
| Canary Islands | 50,18687 | 49,9134 | 53,31132 | 51,1371967 |
| Cantabria | 42,21991 | 47,39508 | 49,04677 | 46,2205867 |
| Castile and Leon | 26,6716 | 29,84438 | 31,29756 | 29,27118 |
| Castilla la Mancha | 28,20605 | 28,71512 | 33,05683 | 29,9926667 |
| Catalonia | 48,78352 | 42,43385 | 43,76423 | 44,9938667 |
| Valencian Community | 37,09393 | 39,60753 | 43,76701 | 40,1561567 |
| Estremadura | 34,72479 | 32,43657 | 29,40873 | 32,19003 |
| Galicia | 31,16301 | 34,86638 | 35,33989 | 33,78976 |
| Madrid's community | 32,64085 | 32,94275 | 36,0477 | 33,8771 |
| Murcia region | 41,08081 | 41,93414 | 49,26709 | 44,0940133 |
| C. Foral of Navarra | 60,32019 | 58,37351 | 61,44778 | 60,04716 |
| Basque Country | 47,80877 | 47,79254 | 52,40568 | 49,3356633 |
| The Rioja | 40,58583 | 45,29975 | 45,45483 | 43,7801367 |
| C. A. of Ceuta | 68,26822 | 59,89852 | 51,90087 | 60,0225367 |
| C. A. from Melilla | 135,85694 | 163,22467 | 168,8115 | 155,96437 |
Table 8, graphic 9: Kidnappings for every 100.000 population
| KIDNAPPING EVERY 100.000 POPULATION | ||||
| 2017 | 2018 | 2019 | Total mean | |
| Andalusia | 0,179 | 0,3101 | 0,36842 | 0,28584 |
| Aragon | 0 | 0 | 0,1516 | 0,05053333 |
| Principality of Asturias | 0 | 0,29176 | 0 | 0,09725333 |
| Balearic Islands | 0 | 0,08858 | 0,52198 | 0,20352 |
| Canary Islands | 0,18974 | 0,094 | 0,04644 | 0,11006 |
| Cantabria | 0 | 0 | 0 | 0 |
| Castile and Leon | 0,08245 | 0,08302 | 0,08335 | 0,08294 |
| Castilla la Mancha | 0,09845 | 0,24669 | 0,04919 | 0,13144333 |
| Catalonia | 0,13235 | 0,06579 | 0,07817 | 0,09210333 |
| Valencian Community | 0,08095 | 0,12088 | 0,09992 | 0,10058333 |
| Estremadura | 0,0926 | 0 | 0,06208667 | |
| Galicia | 0,14769 | 0,07403 | 0,03704 | 0,08625333 |
| Madrid's community | 0,10757 | 0,18242 | 0,24012 | 0,17670333 |
| Murcia region | 0 | 0,20291 | 0,20082 | 0,13457667 |
| C. Foral of Navarra | 0,15546 | 0,46328 | 0,15286 | 0,2572 |
| Basque Country | 0,41018 | 0,22737 | 0,31706 | 0,31820333 |
| The Rioja | 0 | 0 | 0 | 0 |
| C. A. of Ceuta | 1,17704 | 0 | 2,35913 | 1,17872333 |
| C. A. from Melilla | 0 | 0 | 0 | 0 |
Table 9, graphic 10: Penetrating sexual assaults for every 100.000 population
| SEXUAL ASSAULT WITH PEN. EVERY 100.000 POPULATION | ||||
| 2017 | 2018 | 2019 | Total mean | |
| Andalusia | 2,06448 | 2,39731 | 3,10188 | 2,52122333 |
| Aragon | 2,06304 | 2,52153 | 2,04655 | 2,21037333 |
| Principality of Asturias | 1,93244 | 1,6533 | 1,17325 | 1,58633 |
| Balearic Islands | 4,48029 | 6,46643 | 7,74277 | 6,22983 |
| Canary Islands | 3,79485 | 4,13595 | 3,43644 | 3,78908 |
| Cantabria | 1,37861 | 1,37877 | 1,72094 | 1,49277333 |
| Castile and Leon | 1,27793 | 2,15843 | 1,83368 | 1,75668 |
| Castilla la Mancha | 1,67366 | 2,56561 | 1,91848 | 2,05258333 |
| Catalonia | 5,21452 | 6,15784 | 7,25712 | 6,20982667 |
| Valencian Community | 2,42841 | 3,38457 | 3,53733 | 3,11677 |
| Estremadura | 0,92599 | 1,95738 | 1,68585 | 1,52307333 |
| Galicia | 1,62461 | 2,07274 | 3,44508 | 2,38081 |
| Madrid's community | 3,39625 | 3,83091 | 3,64679 | 3,62465 |
| Murcia region | 2,7886 | 3,11124 | 3,28001 | 3,05995 |
| C. Foral of Navarra | 4,50847 | 5,55938 | 4,27995 | 4,7826 |
| Basque Country | 3,46374 | 5,04755 | 5,57122 | 4,69417 |
| The Rioja | 2,21954 | 2,21747 | 2,84093 | 2,42598 |
| C. A. of Ceuta | 5,88519 | 5,8724 | 1,17957 | 4,31238667 |
| C. A. from Melilla | 0 | 2,31524 | 5,78122 | 2,69882 |
Table 10, graphic 11: Non-penetrative sexual assaults for every 100.000 population
| SEXUAL ASSAULT WITHOUT PEN. EVERY 100.000 POPULATION | ||||
| 2017 | 2018 | 2019 | Total mean | |
| Andalusia | 22,56612 | 25,60706 | 26,79981 | 24,9909967 |
| Aragon | 18,87297 | 23,76353 | 23,19428 | 21,9435933 |
| Principality of Asturias | 12,17438 | 18,4781 | 17,69652 | 16,1163333 |
| Balearic Islands | 41,84592 | 45,26498 | 56,89628 | 48,0023933 |
| Canary Islands | 25,85241 | 31,16063 | 38,86896 | 31,9606667 |
| Cantabria | 13,09679 | 16,2005 | 16,69311 | 15,3301333 |
| Castile and Leon | 13,89232 | 16,2297 | 19,33698 | 16,4863333 |
| Castilla la Mancha | 16,5889 | 21,56101 | 23,85798 | 20,6692967 |
| Catalonia | 24,06089 | 28,02608 | 32,23362 | 28,1068633 |
| Valencian Community | 24,85071 | 28,52709 | 31,4363 | 28,2713667 |
| Estremadura | 13,24172 | 17,98925 | 18,35704 | 16,5293367 |
| Galicia | 15,32304 | 17,91436 | 20,11484 | 17,78408 |
| Madrid's community | 23,89667 | 26,83154 | 29,68457 | 26,80426 |
| Murcia region | 23,8051 | 29,28626 | 32,26459 | 28,4519833 |
| C. Foral of Navarra | 31,55928 | 36,29041 | 31,18246 | 33,0107167 |
| Basque Country | 19,32404 | 24,91942 | 24,68548 | 22,9763133 |
| The Rioja | 15,85384 | 17,42298 | 26,19966 | 19,8254933 |
| C. A. of Ceuta | 23,54077 | 52,85164 | 25,95043 | 34,11428 |
| C. A. from Melilla | 33,67394 | 28,94054 | 32,37481 | 31,6630967 |
Table 11, graphic 12: Robberies with violence for each 100.000 population
| THEFT WITH VIOLENCE EVERY 100.000 POPULATION | ||||
| 2017 | 2018 | 2019 | Total mean | |
| Andalusia | 91,50555 | 85,31312 | 87,28061 | 88,0330933 |
| Aragon | 60,97421 | 71,06137 | 80,64938 | 70,8949867 |
| Principality of Asturias | 35,8468 | 34,62213 | 35,97966 | 35,4828633 |
| Balearic Islands | 121,32627 | 109,39775 | 114,40155 | 115,041857 |
| Canary Islands | 68,11753 | 70,26416 | 71,79381 | 70,0585 |
| Cantabria | 36,87779 | 31,02223 | 38,72114 | 35,5403867 |
| Castile and Leon | 29,92826 | 29,4708 | 29,67225 | 29,6904367 |
| Castilla la Mancha | 50,50508 | 48,00654 | 48,25706 | 48,9228933 |
| Catalonia | 272,83568 | 296,12905 | 344,58961 | 304,518113 |
| Valencian Community | 109,1367 | 103,16894 | 99,58493 | 103,963523 |
| Estremadura | 25,65005 | 23,48855 | 29,97068 | 26,36976 |
| Galicia | 39,02761 | 35,42158 | 35,04354 | 36,4975767 |
| Madrid's community | 250,70753 | 220,32268 | 233,90482 | 234,978343 |
| Murcia region | 99,16526 | 97,7336 | 102,28275 | 99,7272033 |
| C. Foral of Navarra | 67,16063 | 39,37896 | 50,59507 | 52,37822 |
| Basque Country | 81,44354 | 81,44285 | 74,41878 | 79,1017233 |
| The Rioja | 32,97599 | 24,70896 | 28,40927 | 28,6980733 |
| C. A. of Ceuta | 154,19202 | 176,17213 | 171,03696 | 167,133703 |
| C. A. from Melilla | 413,37668 | 385,48805 | 431,27869 | 410,047807 |
Table 12, graphic 13: Burglaries in dwellings for each 100.000 population
| THEFT IN HOUSE EVERY 100.000 POPULATION | ||||
| 2017 | 2018 | 2019 | Total mean | |
| Andalusia | 294,97054 | 274,70037 | 266,86902 | 278,846643 |
| Aragon | 195,22445 | 190,87236 | 177,97438 | 188,02373 |
| Principality of Asturias | 167,83257 | 144,71273 | 152,8158 | 155,120367 |
| Balearic Islands | 383,60249 | 361,4112 | 310,66762 | 351,89377 |
| Canary Islands | 253,63819 | 235,56119 | 200,14962 | 229,783 |
| Cantabria | 282,44255 | 271,2722 | 280,16893 | 277,961227 |
| Castile and Leon | 213,70261 | 221,73667 | 198,57907 | 211,33945 |
| Castilla la Mancha | 382,43073 | 365,15564 | 320,97588 | 356,187417 |
| Catalonia | 412,91294 | 453,74612 | 442,89302 | 436,51736 |
| Valencian Community | 436,40515 | 440,11497 | 396,16137 | 424,227163 |
| Estremadura | 202,978 | 187,53559 | 155,56659 | 182,026727 |
| Galicia | 200,78727 | 197,9833 | 195,99933 | 198,256633 |
| Madrid's community | 296,74895 | 293,82438 | 273,95949 | 288,177607 |
| Murcia region | 473,10942 | 457,01447 | 413,95062 | 448,024837 |
| C. Foral of Navarra | 236,15045 | 233,18519 | 231,42275 | 233,58613 |
| Basque Country | 331,06094 | 363,87812 | 369,6933 | 354,877453 |
| The Rioja | 228,92945 | 190,38568 | 174,24352 | 197,852883 |
| C. A. of Ceuta | 97,69418 | 103,35432 | 68,41478 | 89,8210933 |
| C. A. from Melilla | 164,88621 | 155,12132 | 113,31183 | 144,439787 |
Table 13, graphic 14: Burglaries for every 100.000 population
| ROBBERY AT HOME EVERY 100.000 POPULATION | ||||
| 2017 | 2018 | 2019 | Total mean | |
| Andalusia | 206,16195 | 187,37161 | 182,4526 | 191,995387 |
| Aragon | 136,5425 | 133,41198 | 118,92751 | 129,62733 |
| Principality of Asturias | 92,37072 | 84,41576 | 88,87368 | 88,5533867 |
| Balearic Islands | 280,01817 | 269,99543 | 225,75818 | 258,590593 |
| Canary Islands | 154,78239 | 151,90218 | 134,625 | 147,10319 |
| Cantabria | 161,81425 | 167,86476 | 183,96842 | 171,21581 |
| Castile and Leon | 130,01891 | 147,64458 | 123,52326 | 133,728917 |
| Castilla la Mancha | 270,73871 | 271,41213 | 233,56222 | 258,57102 |
| Catalonia | 308,59614 | 339,65499 | 311,69151 | 319,98088 |
| Valencian Community | 342,56742 | 350,92752 | 305,14998 | 332,88164 |
| Estremadura | 119,26809 | 109,33362 | 93,1901 | 107,263937 |
| Galicia | 125,61204 | 124,88234 | 116,28084 | 122,258407 |
| Madrid's community | 193,04818 | 194,47927 | 172,3446 | 186,624017 |
| Murcia region | 396,25294 | 381,60065 | 335,63202 | 371,16187 |
| C. Foral of Navarra | 148,46852 | 152,41972 | 153,77231 | 151,553517 |
| Basque Country | 184,94566 | 206,17638 | 227,28755 | 206,13653 |
| The Rioja | 186,12408 | 146,66983 | 137,94279 | 156,912233 |
| C. A. of Ceuta | 67,09119 | 70,46885 | 49,54174 | 62,36726 |
| C. A. from Melilla | 114,95588 | 105,34358 | 82,09326 | 100,797573 |
Table 14, graphic 15: Thefts for every 100.000 population
| HURTS EACH 100.000 POPULATION | ||||
| 2017 | 2018 | 2019 | Total mean | |
| Andalusia | 1238,04569 | 1112,66055 | 1086,23001 | 1145,64542 |
| Aragon | 840,80229 | 812,16265 | 796,94321 | 816,63605 |
| Principality of Asturias | 701,57301 | 701,09818 | 663,66836 | 688,77985 |
| Balearic Islands | 2614,9665 | 2436,15955 | 2297,42662 | 2449,51756 |
| Canary Islands | 1429,09254 | 1282,00368 | 1214,17914 | 1308,42512 |
| Cantabria | 858,70118 | 802,0971 | 839,9905 | 833,59626 |
| Castile and Leon | 868,57908 | 817,75255 | 801,85935 | 829,396993 |
| Castilla la Mancha | 748,22334 | 712,99339 | 681,64948 | 714,288737 |
| Catalonia | 2298,67533 | 2527,0047 | 2502,23544 | 2442,63849 |
| Valencian Community | 1495,9398 | 1412,21181 | 1359,73503 | 1422,62888 |
| Estremadura | 670,88303 | 616,48132 | 615,24197 | 634,202107 |
| Galicia | 750,27535 | 734,37777 | 699,6113 | 728,08814 |
| Madrid's community | 2402,40633 | 2319,8566 | 2314,39113 | 2345,55135 |
| Murcia region | 1037,9705 | 997,28848 | 1014,05852 | 1016,43917 |
| C. Foral of Navarra | 1177,17658 | 1196,19368 | 1305,53611 | 1226,30212 |
| Basque Country | 1270,32784 | 1335,91743 | 1370,3383 | 1325,52786 |
| The Rioja | 812,66785 | 741,90227 | 764,52503 | 773,031717 |
| C. A. of Ceuta | 953,40105 | 1014,75148 | 970,78217 | 979,6449 |
| C. A. from Melilla | 1339,99071 | 1422,71717 | 1392,11673 | 1384,94154 |
Table 15, graphic 16: Vehicle thefts for each 100.000 population
| VEHICLE SUBSTRACTIONS EACH 100.000 POPULATION | ||||
| 2017 | 2018 | 2019 | Total mean | |
| Andalusia | 104,47718 | 82,70113 | 77,76103 | 88,3131133 |
| Aragon | 29,95224 | 21,92969 | 18,57058 | 23,48417 |
| Principality of Asturias | 38,0691 | 21,20119 | 21,80289 | 27,0243933 |
| Balearic Islands | 153,85318 | 128,26555 | 124,84123 | 135,65332 |
| Canary Islands | 85,24179 | 64,57723 | 59,8127 | 69,87724 |
| Cantabria | 35,67151 | 21,37087 | 23,06059 | 26,70099 |
| Castile and Leon | 27,16628 | 24,3653 | 24,08787 | 25,2064833 |
| Castilla la Mancha | 54,39387 | 33,00758 | 30,94158 | 39,4476767 |
| Catalonia | 117,19427 | 120,97265 | 126,55017 | 121,572363 |
| Valencian Community | 79,28752 | 66,54306 | 64,51137 | 70,1139833 |
| Estremadura | 31,11342 | 15,00658 | 13,48681 | 19,8689367 |
| Galicia | 29,31686 | 21,6897 | 22,37452 | 24,46036 |
| Madrid's community | 164,66416 | 132,43988 | 121,34957 | 139,484537 |
| Murcia region | 87,94285 | 64,72737 | 60,57977 | 71,08333 |
| C. Foral of Navarra | 26,27349 | 26,87035 | 28,12535 | 27,08973 |
| Basque Country | 41,01801 | 42,19931 | 40,31206 | 41,17646 |
| The Rioja | 28,21984 | 25,02574 | 21,46478 | 24,9034533 |
| C. A. of Ceuta | 254,24028 | 291,27126 | 198,16696 | 247,892833 |
| C. A. from Melilla | 131,21226 | 101,87072 | 87,87448 | 106,98582 |
Table 16, graphic 17: Drug trafficking for each 100.000 population
| DRUG TRAFFICKING EVERY 100.000 POPULATION | ||||
| 2017 | 2018 | 2019 | Total mean | |
| Andalusia | 41,43287 | 43,60475 | 51,06819 | 45,3686033 |
| Aragon | 20,63037 | 25,67378 | 26,3778 | 24,2273167 |
| Principality of Asturias | 12,56087 | 13,61545 | 19,94525 | 15,3738567 |
| Balearic Islands | 43,27961 | 45,53073 | 56,2003 | 48,33688 |
| Canary Islands | 28,31906 | 29,28065 | 26,74853 | 28,11608 |
| Cantabria | 10,85655 | 14,99408 | 13,76751 | 13,2060467 |
| Castile and Leon | 13,76865 | 16,93534 | 18,25344 | 16,3191433 |
| Castilla la Mancha | 20,96994 | 21,65968 | 22,62818 | 21,7526 |
| Catalonia | 30,02979 | 32,26288 | 33,94041 | 32,0776933 |
| Valencian Community | 32,21688 | 35,43725 | 39,2704 | 35,64151 |
| Estremadura | 18,61249 | 21,71759 | 27,81654 | 22,71554 |
| Galicia | 13,69843 | 15,98968 | 18,85535 | 16,1811533 |
| Madrid's community | 24,71115 | 29,70472 | 36,42288 | 30,2795833 |
| Murcia region | 19,92827 | 19,41145 | 23,83027 | 21,0566633 |
| C. Foral of Navarra | 20,83223 | 21,61982 | 24,30397 | 22,2520067 |
| Basque Country | 15,13109 | 16,68874 | 19,06896 | 16,96293 |
| The Rioja | 25,36614 | 23,12505 | 32,82849 | 27,10656 |
| C. A. of Ceuta | 267,1877 | 194,96383 | 350,33087 | 270,827467 |
| C. A. from Melilla | 74,31491 | 55,56585 | 72,84332 | 67,5746933 |
- Annexed: Table 5, graphic 6: Murders for every 100.000 population ↑
- Annexed: Table 6, graphic 7: You fight for every 100.000 population. ↑
- Annexed: Table 7, graphic 8: You fight for every 100.000 population. ↑
- Annexed: Table 7, graphic 9: Kidnappings for every 100.000 population. ↑
- Annexed: Table 9, graphic 10: Penetrating sexual assaults for every 100.000 population. ↑
- Annexed: Table 10, graphic 11: Non-penetrative sexual assaults for every 100.000 population. ↑
- Annexed: Table 11, graphic 12: Robberies with violence for each 100.000 population. ↑
- Annexed: Table 12, graphic 13: Burglaries in dwellings for each 100.000 population. ↑
- Annexed: Table 13, graphic 14: Burglaries for every 100.000 population. ↑
- Table 14, graphic 15: Thefts for every 100.000 population. ↑
- Annexed: Table 15, graphic 16: Vehicle thefts for each 100.000 population. ↑
- Table 16, graphic 17: Drug trafficking for each 100.000 population. ↑
- Cordoba Ordonez, J., & Garcia Alvarado, J. M. (1992). Contribution to the Social Geography of Spain: regional differences in wage employment. Annals of Geography of the Complutense University, 12, 215 ↑