
FINAL PROJECT
DEGREE IN CRIMINOLOGY
COLLEGE: University of Valencia
FACULTY: Law School
STUDENT: Kateryna Andriana Ivashkiv Shulhan
TUTOR/A: Sergio Iserte Agut
DEPARTMENT OF THE GUARDIAN: IT Department
ACADEMIC COURSE: 2019-2020
The use of statistics in Criminology acquires great relevance when it comes to observing patterns in the temporal and spatial distribution of crime, as well as to identify which are the factors most linked to crime. Thus, The objective of this study is to carry out an analysis of crime in the different autonomous communities of Spain. This will be done taking into account the following elements; amount of crimes, territorial space, time and demographic factors, economic, educational and social.
For it, The statistical analysis methodology will be used through the use of official public data provided by the Ministry of the Interior and the National Institute of Statistics. Also, as an external support tool that uses the same database, a virtual and interactive map on crime in the country has been carried out. This allows having a spatial orientation on the distribution of the crime and makes it possible to create a certain degree of interaction with the reader.
As a result, the following has been identified: a higher crime rate in areas washed by the Mediterranean coast, patterns of criminal activity during the quarters of the year and the most and least common criminal typologies of each autonomous community. Likewise, Four of the twelve selected factors have been found to have a certain degree of relationship with the crime rate; The tourism, immigration, the aging of the population and Social Work Units.
Special thanks to Ángel Langdon Villamayor, Data Science student at the Polytechnic University of Valencia, for having prepared the virtual map of crime in Spain that complements this study.
INDEX
1. NATURE OF WORK 5
1.1 INTRODUCTION 5
1.2 THEORETICAL FRAMEWORK 6
1.3 DELIMITATION OF THE OBJECT OF STUDY 10
1.4 OBJECTIVES 11
1.5 EXPLANATION OF THE MAP 12
1.6 METHODOLOGY 13
2. ANALYSIS 16
2.1 ANALYSIS OF TOTAL CRIMES 16
CRIMINALITY INDEX OF THE AUTONOMOUS COMMUNITIES 16
THE EVOLUTION OF CRIMINALITY OVER TIME 18
RESULTS AND CONCLUSIONS OF THE SECTION 24
2.2 ANALYSIS OF THE TYPES OF CRIME 27
SEXUAL ASSAULT WITH PENETRATION 33
SEXUAL ASSAULT WITHOUT PENETRATION 35
RESULTS AND CONCLUSIONS OF THE SECTION 47
2.3 ANALYSIS OF THE DETERMINING FACTORS OF CRIMINALITY 54
AVERAGE ANNUAL HOUSEHOLD INCOME 61
EARLY WITHDRAWAL FROM EDUCATION 68
PUBLIC SPENDING ON EDUCATION 70
RESULTS AND CONCLUSIONS OF THE SECTION 75
3. SYNTHESIS OF RESULTS BY AUTONOMOUS COMMUNITY 80
4. CONCLUSIONS AND CONTRIBUTIONS 92
5. MEMORY 98
6. BIBLIOGRAPHY 99
The growing concern about different political causes, The economic and socio-cultural aspects of the crime phenomenon have led to the development of the "third level of interpretation" of Criminology; obtaining generalizable results on crime through statistics from official sources (Rodriguez-Manzanera, 1979). On the other hand, and with the evolution of technology, study methods have been developed that allow monitoring of information on a large scale. Digitized cartography and, more concretely, Geographic Information Systems (SIG) represent and locate crime databases on maps. Likewise, allow establishing a relationship between crime rates and other physical factors, geographic and social (Garrido, Stangeland, & Redondo, 1999; Vozmediano & San Juan, 2010).
The combination of both methods, statistics and cartography, makes possible the identification of crime patterns that can predict future patterns. This has a very important purpose; the preparation of studies that provide information on the causes of crime so that preventive or repressive-preventive measures and laws are carried out (Garrido et al., 1999; Orellana, 2016). These causes and factors have been studied by numerous authors; demographics such as immigration (Williams, Weiss, Adelman & Jaret, 2005), economic factors such as poverty (Assemble & Cisterns, 2002) or elements of the educational field (Barreto, 2002) have contributed results of interest to the crime analysis, always taking into account the specific circumstances of each object of study.
In this way, This work will carry out an analysis on crime based on statistics from the Ministry of the Interior and the National Institute of Statistics (OTHER). The results obtained will be supported by a virtual crime map[1], which allows creating a visual and spatial representation of the crime. Likewise, A correlation study will also be carried out with different demographic factors., economic, educational or social to determine which are the most explanatory of the crime.
The field of Criminology is very extensive, it is the science that studies both individual crime and crime in general. In this way, and as in all scientific research, you need to know the causes, factors or conditions that cause the phenomenon with which it deals to occur; antisocial behavior. How crime is present in many areas (social, psychological, legal, etc.), this forces it to be a multidisciplinary science. In consecuense, research methods also need to be varied, the most appropriate should be used, taking into account the context of the study (Orellana, 2016).
In this way, three levels of interpretation in this field could be summarized, which are related to each other: a behavioral one, in which antisocial behavior is studied at a concrete level; a personal one, that seeks knowledge of the offender's personality in order to treat and rehabilitate him; and one general, which is based on the set of criminal behaviors and their characteristics in a given place and time. The third level of general interpretation requires a methodology based on statistics, since it is not valid to make generic interpretations of particular cases. Also, generally the data must come from official sources (Rodriguez-Manzanera, 1979). This statistical method allows finding the typical or characteristic in what seems irregular, relate some phenomena to others and deduce the general laws that govern it (Quiroz & Quiroz, 1970).
However, Caution should be exercised when using this methodology; its precision depends a lot on the terminology used, the legal classification, political criteria, etc. Thus, it is essential to know the definitions of the concepts of the data with which you are working. For example, it must be possible to verify that the legal descriptions of "homicide" or "robbery" are used in accordance with current legislation. Likewise, data that is of an economic nature, social, etc., should use conventional or technical descriptions. (Rodriguez-Manzanera, 1979).
It should be noted that one of the most important objectives of carrying out this entire process is the following; provide the State with studies that allow the legislator to enact preventive or repressive-preventive laws with knowledge about the causes and factors of crime. (Orellana, 2016). As Rodríguez-Manzanera says (1979):
Today's great concern about political factors, economic and socio-cultural of crime, have led to the third level of interpretation to a great hierarchy, studying the phenomenon as a whole and not so much the behaviors or the isolated authors.
On the other hand, Geography is also present in this relationship and exchange of knowledge between different disciplines. For example, in his first jobs, Guerry and Quetelet developed maps on the geographic distribution of crime to establish the relationship between physical and social factors (Guerry, 1833; Quetelet, 1842 cited by Orellana, 2016). However, and despite the fact that for almost two hundred years the study of the distribution and spatial orientation of crime has been internationally recognized, Geography and Criminology have not been specially linked in Spain (Hernando, 2000). THE, at least, not until recently.
Geographic Information Systems (SIG) they are an essential tool that allows working simultaneously with numerical databases and with geographic representations. In this way, the study and monitoring of large-scale spatial processes that, in this case, would be the crimes. From the years 90, and together with the development of technology, the use of GIS has shown utility in many countries. Due to its effective results, It is a tool that has generated great interest among Criminology professionals (Vozmediano & San Juan, 2010).
The appearance of digitized cartography allows crime databases to be represented and located on maps. This is ideal for identifying hot spots or "hotspots", that is to say, geographic concentrations of certain crimes. In this way, a relationship between crime rates and other physical factors can be established, geographic and social (Garrido et al., 1999). Hotspot mapping has been used by police and crime fighting agencies in many countries.. This type of analysis uses a basic prediction technique, with the premise that the crime patterns identified will also serve to identify future patterns (Chaney, Tompson & Uhlig, 2008). From now on, and transferring the information to the relevant authorities, Prevention policies and measures can be implemented with adequate knowledge of the determinants of crime (Garrido et al., 1999). This, as indicated before by Orellana (2016), It is one of the main objectives of Criminology.
It should be mentioned that this statistical and cartographic study can have a micro or macro application, that is to say, can be applied to neighborhoods / cities or regions / countries. Thus, the factors and variables studied will not be the same in both cases. If national data are used, the causes of crime must be common to all areas of the territory. So that, and following the line of study on a large scale, the factors or conditions that are related to crime have been studied by numerous authors.
Regarding the demographic scope, the immigration and tourism variables have been highly analyzed and controversial. Regarding the first, the vision of a close relationship between the foreign population and crime has been shared by citizens, media or political entities for many years (Garcia, 2019). However, there are numerous research papers that indicate just the opposite; immigration does not increase crime rates (Mears, 2001). In fact, there are characteristics of foreigners that contribute to the fact that rates do not increase (Williams et al., 2005).
Regarding tourism, there are also studies with contradictions, although most speak of a positive relationship with crime. According to Pizam (1982), the number of tourists visiting a territory had little correlation with crime rates. However, and in the case of Spain, Montolio and Planells (2012) determined that there is a relationship, especially in crimes committed against people and property.
On the other hand, the economic field has been one of the most studied. Some authors determine that the link between income of the population and crime rates is not given clearly and concisely in all crimes, only with those who are against property (Corman & Mocan, 2005; Cars & Meghir, 2000). Other authors indicate that crime increases when the income of the population decreases, especially if there is also a situation of involuntary unemployment (Raphael & Winter-Ember, 2001).
Following this line, a large number of articles establish that the unemployment rate is directly related to crime, and that this is much more noticeable in property crimes (Garcia, 1994; Raphael & Winter-Ember, 2001). However, here García indicates that the link between crime and unemployment is weak, it is highly correlated with other market variables and the results vary a lot.
To end the economic field, the population's poverty rate is also a very recurring theme when it comes to talking about crime. The 10th United Nations Congress on Crime Prevention and Treatment of Offenders of the year 2000 concluded that the condition of poverty was present in the areas where more crimes are observed. So that, Research results that measure poverty in depth establish that elements of deprivation and marginality affect crime (Assemble & Cisterns, 2002).
Then, the educational field is presented as another of the determining factors of crime. In this aspect, the UN at the 10th United Nations Congress on Crime Prevention and Treatment of Offenders of the year 2000 He also mentioned that high schooling reduces antisocial behaviors. Many times, school failure leads to emotional and self-esteem issues, which lead to dysfunctional and / or criminal behaviors (Ferreira, 1998). It should also be noted the existence of research that sees school dropout not as a risk factor that acts in isolation, but it does it together with other factors such as lack of attendance, problematic peer relationships, etc. Thus, it is configured as a cause and as the "first milestone in the criminal trajectory" (Barreto, 2002).
To end, there are also risk factors in the social sphere. As usual, These factors are associated with vulnerable populations or personalities who are more likely to engage in criminal behavior. So that, the term Support Networks appears, which is the contact between a person with other people or institutions to help them resolve conflicts that may arise at different stages of their life. These networks can have a major effect on your growth and training period and, the absence of these, could lead to school failure and increase the likelihood of criminal behavior (Barreto, 2002).
The initial intention of this project was the elaboration of an interactive crime map of the city of Valencia, province of the Valencian Community. For it, Anonymous data was required from different criminal categories disaggregated by streets or, failing that, city districts. The purpose was the subsequent cartographic analysis of the crimes, putting it in relation to the different factors of an area; historical, demographic, economic, social, cultural, etc. This allowed for targeted and micro-scale prevention.; would have the objective of making visible and expanding the specific problems of each area, working interrelated with all elements (Varona, 2012). Likewise, situational prevention could have been implemented, that starts from the premise that crimes are not distributed randomly or evenly over urban geography; there are areas, places and times where the best opportunities for crime coincide (Ocáriz, Vozmediano & German, 2011).
However, it was not possible to carry out this. The different bodies contacted (Valencia City Council, Ministry of Interior, National Police Corps and Local Police Corps) they were unable to provide such information, either by law or because they did not have it. However, It is known that there are already jobs in Spain that have carried out projects of such magnitude. For example, the “Spatial analysis of georeferential data of criminological interest in the C.A. of Euskadi ” (Varona, 2012), "Ecological analysis of crime in the city of Barcelona" (Sánchez, 2017) o “The crime hot spots: An analysis of the spatial distribution of the criminal phenomenon in the city of Albacete " (Fernandez, Vazquez & Belmonte, 2013). Thus, the possibility of carrying out this project later on cannot and should not be ruled out.
In this way, the object of study of this research happened to be crime in the different autonomous communities of Spain. The analysis is based on the spatial and temporal distribution of the crime, as well as in its relationship with other demographic factors, economic, educational or social of each community. Also, as a complementary tool to this study, a virtual crime map has been produced. The person who has carried it out is Ángel Langdon Villamayor, Data Science student at the Polytechnic University of Valencia. The map can be consulted on the following web page: https://entredatos.es/mapa/crimen/espana/
Study crime in the autonomous communities of Spain taking into account the timeline, the criminal typologies and the factors that could be determining factors for the crime.
- Identify which are the autonomous communities of the country with a high index, medium and low crime.
- Analyze the criminal activity of the territories during 2017, 2018 and 2019, as well as during their trimesters.
- Find out which of the twelve criminal typologies have a higher or lower commission rate according to the autonomous community.
- Determine which of the twelve selected factors are those that have a greater relationship with crime; the demographics, the economic ones, educational and / or social.
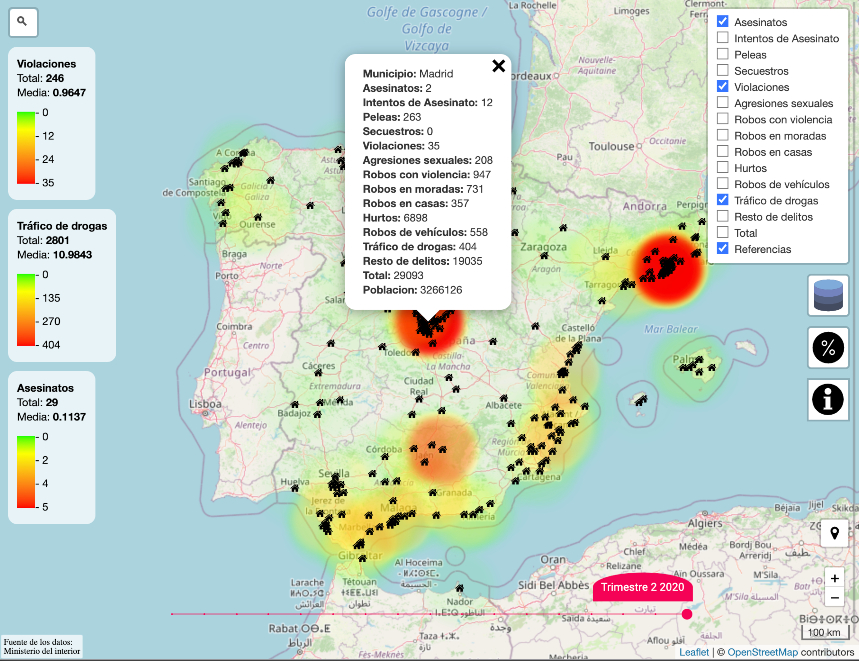
The interactive map of crime in Spain is a tool that helps to identify the territories and quarters with the highest and lowest criminal activity, as well as some of the most and less common typologies. It has been carried out using the official data provided by the Ministry of the Interior both for all crimes in Spain and for some specific crimes; Intentional homicides and completed murders; intentional homicides and attempted murders; felony and less serious offenses of injury and riot; kidnappings; penetrative sexual assault; other crimes against sexual freedom and indemnity; robbery with violence and intimidation; burglaries at homes, establishments and other facilities; robberies with force only in homes; thefts; vehicle thefts and drug trafficking.
This tool offers the possibility of carrying out different functionalities. First, shows criminal activity divided into the four quarters of 2017, 2018, 2019 and the first two quarters of 2020, as well as the total annual crimes. Secondly, a search can be made according to the territorial organization of the country: autonomous communities, provinces and municipalities (collect the 244 most populated municipalities in Spain). You can also filter the number of crimes in absolute terms or for each 100.000 population, as well as seeing the incidence of a specific crime or of several of them.
As is typical of maps, It has a legend that helps to visually identify the areas with a higher or lower concentration of crime through colors. Likewise, this indicates the total and the average of crimes (both in absolute terms and for each 100.000 population). It is important to note that each quarter has a different legend because the number of crimes varies along the timeline.. The highest number of crimes in a territory in a quarter will be the maximum reference value, and the other figures that are close to this maximum value will be indicated in red. In the same way, the lowest number of crimes in a territory in a quarter will be the minimum reference value, and the other figures that are close to this minimum value will appear green or almost transparent. The rest of the territories will follow the corresponding colors indicated in the legend according to the number of crimes committed (Red, orange, yellow or green).
This work is structured in three main sections; one related to the analysis of total crimes by autonomous community; another that carries out an analysis of twelve specific criminal typologies in each autonomous community; a last section that performs a correlation study of twelve factors that may be determining factors in explaining crime.
The first and second sections have been made with the public and official data provided by the Ministry of the Interior on crimes in Spain for each 100.000 population. Both total crimes and 12 specific criminal typologies; Intentional homicides and completed murders; intentional homicides and attempted murders; felony and less serious offenses of injury and riot; kidnappings; penetrative sexual assault; non-penetrative sexual assault; robbery with violence and intimidation; burglaries at homes, establishments and other facilities; robberies with force only in homes; thefts; vehicle thefts and drug trafficking.
The data collected from the Ministry of the Interior are classified by autonomous communities and are divided into the four quarters of 2017, 2018 and 2019. Also, it is necessary to emphasize that they will not be absolute, but proportional to the population of each territory of the country. These provide a more real and objective view of the criminal phenomenon, Well, it is not the same to register 1 crime for each 20 inhabitants to what 1 crime for each 100 population.
First, the data extracted is ordered according to the interest of the study. Likewise, the means are calculated, medians and ranges and the relevant graphs were carried out. The first section contains an analysis of the territories with high crime, medium or low, as well as on how crime behaves in the timeline. Regarding the second section, contains an analysis of which communities are more prone to committing a certain type of crime.
Along with the analysis of the charts, the virtual map is used as a complementary observation tool. Because the databases are the same, It serves as a support for the information collected and allows to have a spatial orientation on the distribution of crime in Spain. Also, the map enables this to be an interactive criminological work with the reader, as you can contrast the information provided and carry out your own searches.
However, it is not possible to approach the criminal reality of a country taking into account only these data. Crime is a multicausal phenomenon in which many of the characteristics that make up the context of a society intervene, and which must be analyzed with an overview.
Because of this, The third and last section consists of an analysis of 12 factors that can be decisive when explaining crime. The official data have been extracted from the National Institute of Statistics (OTHER) and statistics from the Ministry of the Interior, two organisms that are closely related. The chosen factors are: aging population, foreign, tourism, PIB per cápita, average annual household income, risk of poverty, unemployment, education level, early dropout from education, public spending on culture, public spending on education and social work units.
Then, twelve correlation analyzes are carried out through the Excel program. These studies make it possible to find out whether a dependent variable (and) can be explained through an independent variable (x). In this case, “Y” will always be the amount of crimes for each 100.000 inhabitants of each autonomous community of the year 2017. For his part, "And" will be each of the factors mentioned above, all relative to the year 2017.
First, statistical analysis considers the correlation coefficient, which indicates whether or not there is a relationship between the two variables. If the value is closer to 0 what to 1 The -1, means there is no relationship. On the contrary, if the value is closer to 1 The -1 what to 0, relationship between variables will be demonstrated. Secondly, the coefficient of determination is taken into account, which provides information on the extent to which "x" explains "y". For example, if the coefficient of determination is 0'62, the dependent variable explains in a 62% to the independent variable. In third place, what is the p-value, which must be less than 0,05 so that there is a statistically significant relationship between the variables. Finally, we have indicated what the equation would be if we wanted to carry out a calculation by assigning a value to "x" and "y".
Likewise, it is important to look at the scatter plot graph with the regression line. An increasing line indicates a direct relationship between the variables. That is to say, when "x" is greater, "Y" is also greater. On the contrary, a decreasing line shows an inverse relationship between the variables. That is to say, when "x" is greater, "Y" is less and vice versa.
LIMITATIONS
It is important to mention that this research work has limitations regarding the source of the data on which it is based.. There are criminologists who believe that there is a biased social construction of crime as a result of official statistics (Vozmediano and San Juan, 2010). Also, these are incomplete, since they only collect crimes that have been reported to the State Security Forces and Bodies. Rodriguez-Manzanera (1979) differentiate three types of figures; an official figure, which are the ones that appear in the official statistics; a black figure, which is the criminal activity that is not registered because it does not reach the knowledge of the authorities; and a real figure, which would be the sum of the previous two and which would vary the results of the study if it were possible to take it into account. Also, this same author refers to the "golden figure", a term expressed by Severín-Carlos Vérsele at the UN Congress in Geneva: “Apart from the black number of criminals who escape all official detection, there is a golden number of criminals who have political power and exercise it with impunity, abandoning citizens and the community to the exploitation of the oligarchy, or that they have an economic power that develops to the detriment of society as a whole”.
Despite this, the information provided by both the INE and the Ministry of the Interior are the only public data, official and large-scale in this matter. Although at the moment it is not possible to know the real and exact crime figure in Spain, A study can be carried out that is aware of these limitations and is as close as possible to the criminal reality of the country.
The analysis is divided into three sections. The first covers the study of the average of total crimes in Spain and the evolution of criminal activity over time.. The second section collects the analysis of twelve criminal typologies. Finally, In the third section, a study is carried out to find out the degree of relationship that exists between the number of crimes committed in 2017 and twelve other factors that may explain crime.
First, a study of the average total crimes and the evolution of crime over time through the data relative to the years 2017, 2018 and 2019.
CRIMINALITY INDEX OF THE AUTONOMOUS COMMUNITIES
This first graph shows the total mean of crimes for each 100.000 inhabitants of the three years[2], allowing to identify which are the areas of the country with a higher and lower crime rate.
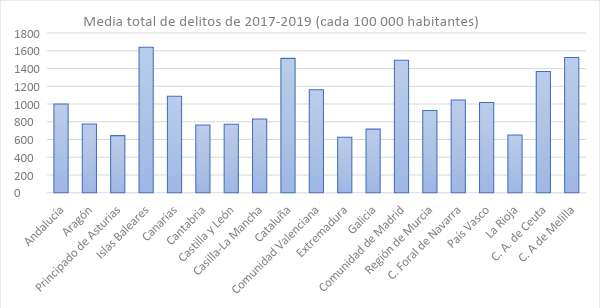
Graphic 1. Own elaboration
To carry out the interpretation of this graph, two statistical terms are going to be introduced that measure the most centric value of a data set; mean and median. The mean is the result of dividing the sum of a set of values by the number of them, and the median is the value that is farthest in the middle of all the data. If they turn out to be two very different figures from each other, it will be more convenient to use one or the other depending on the situation. In this case, the total mean of all communities is 1028,82 crimes for each 100.000 population, and the median is 1000,33. Seeing that both values are similar, the mean will be used as the reference value since it is the most widely used measure of central tendency.
Thus, These are the autonomous communities whose means are above the total average: Balearic Islands (1638,75), Autonomous City of Melilla (1523,8), Catalonia (1513,66), Madrid's community (1493,28), Autonomous City of Ceuta (1366,84), Valencian Community (1159,67), Canary Islands (1087,3) and Foral Community of Navarra (1044,45). On the other hand, these are the territories whose average is below the total average: Basque Country (1016,33), Andalusia (1000,33), Murcia region (926,6) and Castilla La Mancha (831,64), Estremadura (625,77), Principality of Asturias (643,02), The Rioja (650,01), Galicia (716,56), Aragon (774,34), Cantabria (763,65) and Castilla y León (771,63).
It could be said that the autonomous communities with an average higher than the total average have a high crime rate, and communities with a mean lower than the total mean have low crime. However, it is convenient to also speak of a “normal” crime rate in the country. Thus, the data will be interpreted as follows; It is considered that those communities that are approximately 100 below or 100 above average.
So that, by order, the territories with the greatest focus of crime are: Balearic Islands (1638,75), Autonomous City of Melilla (1523,8), Catalonia (1513,66), Madrid's community (1493,28), Autonomous City of Ceuta (1366,84) and Valencian Community (1159,67). On the other hand, areas with medium crime are: Canary Islands (1087,3), Foral Community of Navarra (1044,45), Basque Country (1016,33), Andalusia (1000,33) and Region of Murcia (926,6). Finally, Communities with the lowest crime rate are: Castilla la Mancha (831,64), Aragon (774,34), Castile and Leon (771,63), Cantabria (763,65), Galicia (716,56), The Rioja (650,01), Principality of Asturias (643,02) and Extremadura (625,77).
THE EVOLUTION OF CRIMINALITY OVER TIME
Then, the behavior of the criminal activity will be determined over time. The graphic 2 shows the mean annual crime for each 100.000 inhabitants over the years 2017, 2018 and 2019[3].
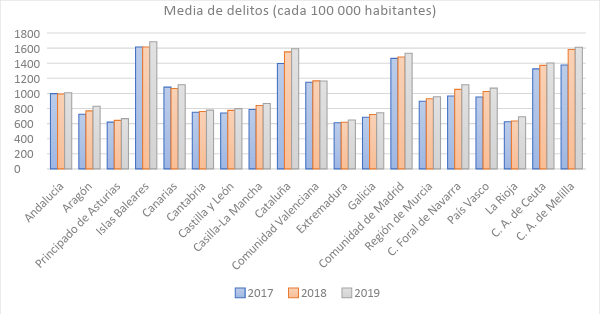
Graphic 2. Own elaboration
At first sight, It is observed that the average of crimes of most communities increases from 2017 a 2018, doing it again in 2019. Thus, it can be said that there has been a general increase in crime in Spain during these years. Following this line, It is interesting to determine which are the territories that have experienced the most notorious growth in crime. For it, the range will be taken into account; a statistical concept that indicates the interval between the maximum value and the minimum value. Once this has been calculated for each autonomous community, it has been verified that the minimum value corresponds to 2017 and the maximum to 2019 (and not the other way around), the highest ranks will determine the autonomous communities with the highest crime rate. In the same way, the ranges closest to 0 determine a stable average crime rate over the three years.
The autonomous communities that have a larger range, with a minimum increase of 100 mean crimes (For each 100.000 population) body 2017 and 2019, son: Autonomous City of Melilla (235,53), Catalonia (195,5), Foral Community of Navarra (149,96), The Rioja (116,38) and Aragon (106, 95). On the other hand, the autonomous communities with the lowest rank, with a maximum increment of up to 50 average crimes for each 100.000 population, son: Andalusia (16,55), Valencian Community (17,42), Cantabria (27,59), Estremadura (36,19) and Principality of Asturias (46,65).
Likewise, and having used the same database, you can see the distribution of crime centers on the map over the years 2017, 2018 and 2019:
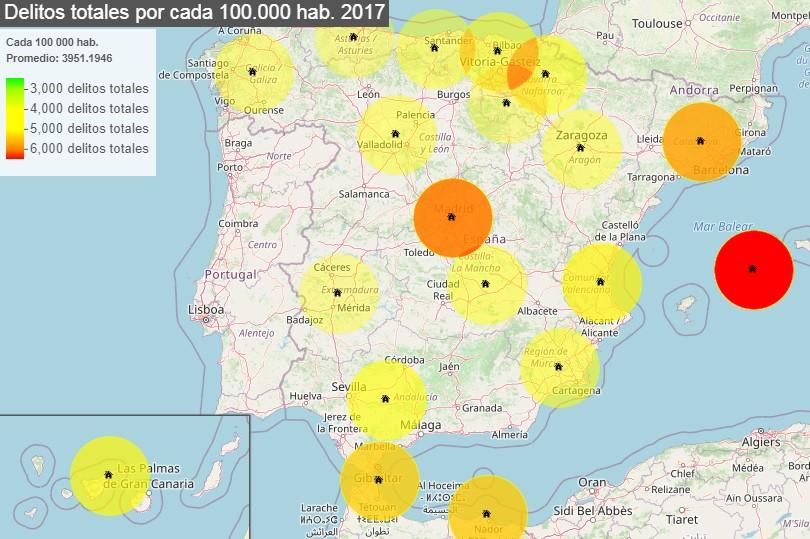
Image of the website: www.entredatos.es/mapa/crimen/espana/
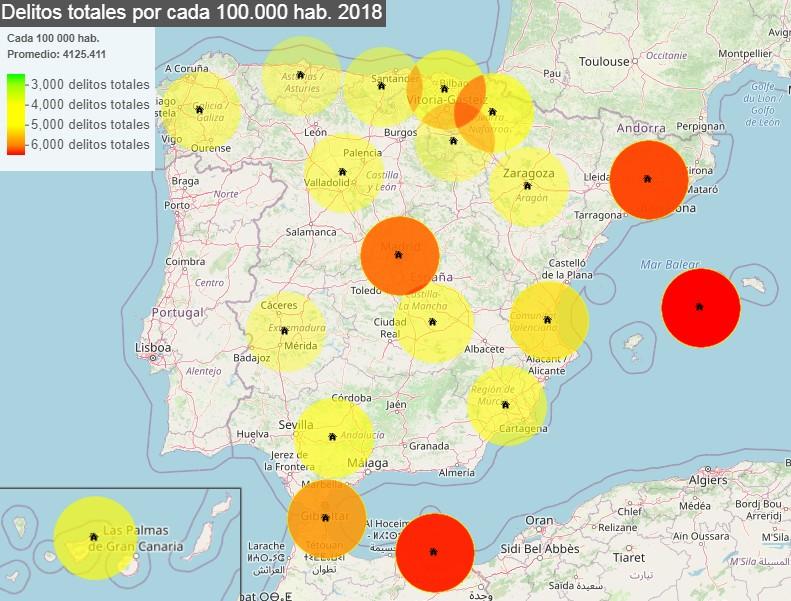
Image of the website: www.entredatos.es/mapa/crimen/espana/
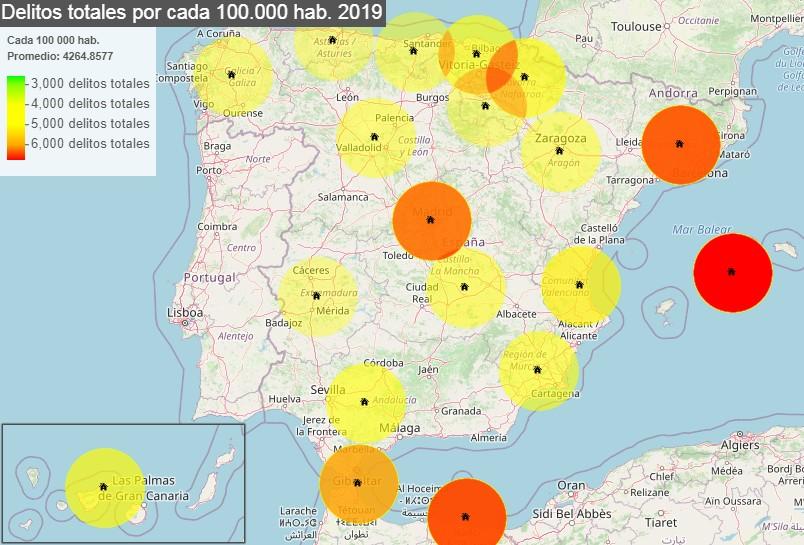
Image of the website: www.entredatos.es/mapa/crimen/espana/
Continuing with the analysis of crime in the timeline, the following three graphs correspond one to each year and show crime according to quarters, indicating the crimes for each 100.000 population[4].
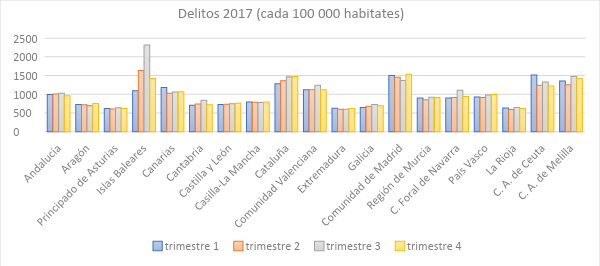
Graphic 3. Own elaboration
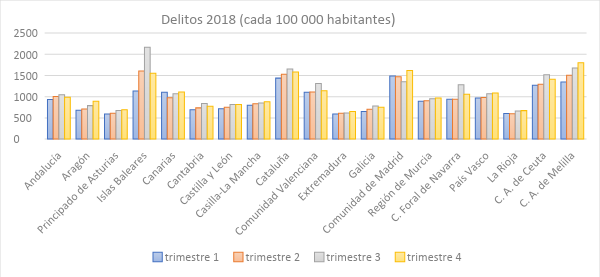
Graphic 4. Own elaboration
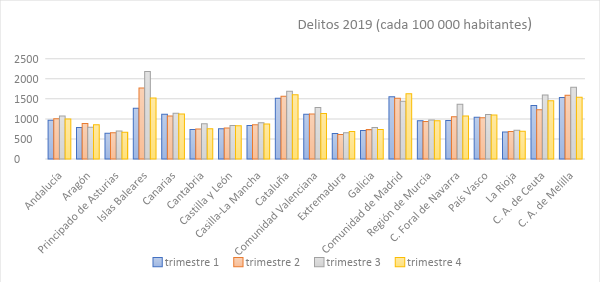
Graphic 5. Own elaboration
The graphics 3, 4 and 5 provide relevant information regarding the behavior of crime during the quarters of the years 2017, 2018 and 2019. Naked eye, and contemplated each graph separately, it can be seen that some of the autonomous communities with the highest crime rates are those with the greatest difference between their quarters (Balearic Islands, Catalonia, Valencian Community, Madrid's community, Foral Community of Navarra, Autonomous City of Ceuta and Autonomous City of Melilla). On the contrary, the communities closest to the value "0" maintain greater stability (Principality of Asturias, Castile and Leon, Castilla la Mancha, Estremadura, Galicia and La Rioja).
Looking at the graphs as a whole and more in depth, similarities can be identified with regard to the quarters of each autonomous community. Thus, almost all the territories maintain a similar pattern during the three years with regard to crime for each period of the year, with the exceptions mentioned below.
- Andalusia: the four quarters of the year have a very similar crime rate, which increases slightly during the third trimester. This pattern is maintained throughout the three years.
- Aragon: the four quarters remain at the same level in 2017. In 2018 crime progressively increases from the first to the last trimester and in 2019 crime is changing. This is one of the communities that does not follow a pattern. However, it is remarkable that, during the three years and unlike the rest of the territories, the rate is lower in the third quarter than in the fourth.
- Principality of Asturias: crime is stable, since the four quarters remain at a very similar level throughout the years. This pattern occurs all three years.
- Islas Baleares: the four quarters of the year are very different. The first quarter has the lowest crime rate, which rises notably in the second trimester and reaches its maximum peak in the third. The fourth quarter drops notably. This pattern remains very stable over the three years.
- Canary Islands: the four quarters have a similar crime rate, highlighting a slight reduction in the second quarter. This pattern occurs all three years.
- Cantabria: there is an increase in crime in the third quarter, while the other three remain at the same level. This pattern happens all three years.
- Castile and Leon: the four quarters remain at very similar levels of crime during the four quarters. This pattern occurs every year.
- Castilla la Mancha: the four quarters have very similar crime levels. This pattern appears every year.
- Catalonia: crime increases slightly from first to second trimester, increases again in the third quarter and decreases in the fourth. This pattern is maintained every year.
- Community Valencian: crime increases third trimester, but the other three stay at the same level. This pattern is very stable over the three years.
- Estremadura: the four quarters remain at very similar levels throughout all quarters, keeping this pattern every year.
- Galicia: all the quarters have a similar crime rate, with a slight elevation in the third trimester. This pattern is repeated all three years.
- Madrid's community: the first two quarters remain very similar, the third quarter decreases in crime and the fourth quarter increases, reaching its maximum peak. This pattern occurs every year.
- Murcia region: maintains similar crime levels in all its quarters. This pattern occurs every year.
- Foral Community of Navarra: there is a rebound in the third quarter, while the rest remain at similar levels. This pattern happens all three years.
- Basque Country: the first quarter remains at the same crime level as the second, in the third it increases a little, and the third and the fourth stay the same again. This pattern is maintained every year.
- The Rioja: all quarters have very similar crime levels. This pattern is maintained for three years.
- Autonomous City of Ceuta: this is one of the communities that does not have a clear pattern. Each year the peak occurs in a different quarter, and these are different from each other.
- Autonomous City of Melilla: this community does not have a clear pattern either. Quarters increase and decrease your crime differently each year.
RESULTS AND CONCLUSIONS OF THE SECTION
First, the areas with the highest and lowest crime rates in Spain have been identified, as well as those that have a normal crime rate. Indicating in parentheses the average of crimes for each 100.000 population, The autonomous communities with the highest crime rate are: Balearic Islands (1638,75), Autonomous City of Melilla (1523,8), Catalonia (1513,66), Madrid's community (1493,28), Autonomous City of Ceuta (1366,84) and Valencian Community (1159,67). On the other hand, Communities with average crime rates are: Canary Islands (1087,3), Foral Community of Navarra (1044,45), Basque Country (1016,33), Andalusia (1000,33) and Region of Murcia (926,6). Finally, The communities with the lowest crime rate in the country are: Castilla la Mancha (831,64), Aragon (774,34), Castile and Leon (771,63), Cantabria (763,65), Galicia (716,56), The Rioja (650,01), Principality of Asturias (643,02) and Extremadura (625,77).
As you can appreciate, the autonomous communities bathed by the Mediterranean Sea present, as usual, more criminality than the interior or northern areas of the country. These areas with the highest crime rates are characterized by a mild climate in winter and high temperatures in summer.. While, the northern or inland areas of Spain have, as usual, a colder winter and a less hot summer. Thus, it is interesting to mention the thermal laws of Quetelet. They postulate that high temperatures excite human passions; the days are longer, people become more irritable, They consume more intoxicating drinks and their social relationships intensify. This can lead to conflicts, quarrels, injuries or even homicides (Quetelet, 1848 cited by Orellana, 2007).
Secondly, the territories of Spain in which crime has increased the most among 2017 and 2019 son, by order: Autonomous City of Melilla, Catalonia, Foral Community of Navarra, La Rioja and Aragon. On the contrary, the areas that have been more stable over time in terms of crime are, by order: Andalusia, Valencian Community, Cantabria, Extremadura and Principality of Asturias.
In third place, It has been observed that some of the areas with the highest crime rates are those with the most noticeable variation in crime between quarters, as Balearic Islands, Autonomous City of Ceuta, Autonomous City of Melilla, Catalonia, Valencian Community, Community of Madrid and Foral Community of Navarra (highlighting the first three mentioned). On the contrary, areas with less crime are more stable throughout the year: Principality of Asturias, Castile and Leon, Castilla la Mancha, Estremadura, Galicia and La Rioja.
By last, patterns have been identified in 2017, 2018 and 2019 with regard to the amount of crimes that are committed in each period of the year. Each autonomous community maintains a similar pattern of crime per quarter during the three years covered by this study, except the Autonomous City of Ceuta, the Autonomous City of Melilla and, to a lesser extent, Aragon. If the territories of the country that do have a pattern are taken into account, could be classified as follows:
- Communities whose crime rate is very stable during all quarters of the year, as the Principality of Asturias, Castilla Leon, Castilla la Mancha, Estremadura, Region of Murcia and La Rioja.
- Communities with a stable crime rate, although with a slight elevation of the third and fourth trimesters, like the Basque Country.
- Communities whose crime is stable and have a slight increase in crime only in the third quarter, like Andalusia and Galicia.
- Communities with a Notorious Increase in Crime During the Third Quarter, as Balearic Islands, Cantabria, Catalonia, Valencian Community and Foral Community of Navarra.
- Communities where crime declines in the third quarter, as Community of Madrid and Aragon.
- Communities where crime declines in the second quarter, as Canarias.
When analyzing these results, It is important to note that the third quarter corresponds to the months of July, August and september. These summer months correspond to a time of vacations and leisure time for many of the citizens. Thus, It must be taken into account that there is a significant increase in foreign tourism and the displacement of the population from inland areas to coastal areas. Likewise, it should be taken into account that each autonomous community has different festive seasons, which can also have a relevant influence on criminal activity.
An interpretation of the graphs will be carried out with the data relative to the means for each 100.000 inhabitants of twelve different criminal typologies during 2017, 2018 and 2019. To determine which communities are around an average in terms of the amount of a crime type, a rule of three will be used following the process in the previous section; with an average of 1000, the values of 100 above or below are within the mean. So that, if the mean is 100, the values that are 10 above or 10 below they will fall within the mean.
In this way, values that are above the mean will have a high index, those who are within the average will have a normal one, and those that are below will have a low index of a specific criminal typology. It should be mentioned that the mean or median will be used as is more convenient in each case. If you want to see the process carried out to calculate the means and medians, go to the annex indicated in each section.
Murders
The murders refer to both intentional homicides and murders, and the Penal Code (1995) collects it in book II, title I; of homicide and its forms[5]. The total average of the three years of all the autonomous communities is 0,70 murders for every 100.000 population, while the median is 0,58.
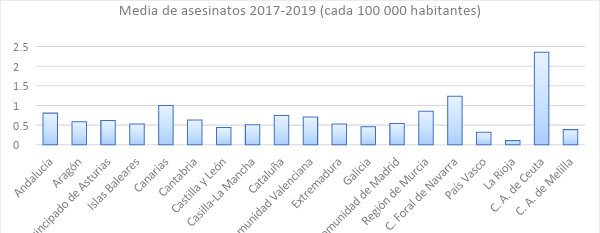
Graphic 6. Own elaboration
As you can see, The Autonomous City of Ceuta far exceeds the rest of the communities with an average of 2,35 murders for every 100.000 population. As a result, this raises the average and does not reflect actual criminal activity in the country. Thus, in this case it is more convenient to use the median than the mean as a reference value. Also, as the median is 0,5, those values that are 0,05 above or below will fall within the normal crime rate.
In this way, territories with a high murder rate are: Autonomous City of Ceuta (2,35), Foral Community of Navarra (1,23), Canary Islands (1), Murcia region (0,85), Andalusia (0,80), Catalonia (0,74) and Valencian Community (0,7). The territories whose rate is within the average are: Cantabria (0,63), Principality of Asturias (0,61), Aragon (0,58), Madrid's community (0,54), Balearic Islands (0,53) and Extremadura (0.53). Finally, communities with the low murder rate are: Castilla la Mancha (0,50), Castile and Leon (0,44), Galicia (0,45), Basque Country (0,31), The Rioja (0,1) and Autonomous City of Melilla (0,38).
For example, the spatial distribution of murders only in 2017 is the next:
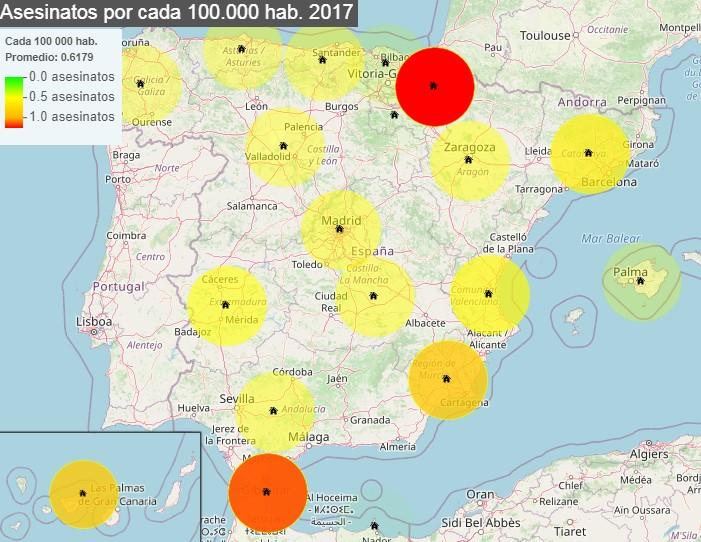
Image of the website: www.entredatos.es/mapa/crimen/espana/
ASSASSINATION ATTEMPTS
The assassination attempts refer to the crimes of intentional homicides and murder in an attempted degree, and the Penal Code (1995) collects it in book II, title I; of homicide and its forms[6]. The total average for the whole of Spain between 2017 and 2019 It is 2,26 For each 100.000 population, while the median is 1,52.
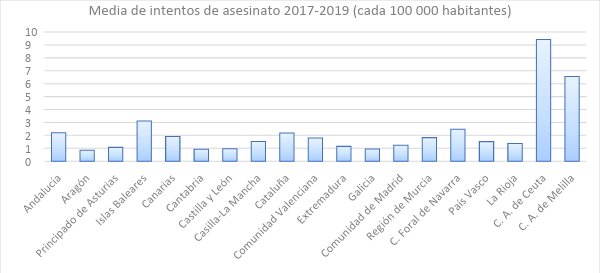
Graphic 7. Own elaboration
These values are different because, as with the completed murders, the Autonomous Cities of Ceuta and Melilla far exceed the rest of the communities (half of 9,42 and 6,56 assassination attempts for every 100.000 population). Thus, it is more appropriate to use the median as a reference value. Also, the territories that are 0,15 above or below this will be included within the average.
So, Communities whose average number of assassination attempts is above the total median are: Autonomous City of Ceuta (9,42), Autonomous City of Melilla (6,56), Balearic Islands (3,11), Foral Community of Navarra (2,47), Andalusia (2,2), Catalonia (2,18), Canary Islands (1,9), Murcia region (1,82) and Valencian Community (1,78). The areas that fall within the crime rate are: Castilla la Mancha (1,52), Basque Country (1,51) and La Rioja (1,37). By last, Communities that have a lower murder attempt rate than the rest are: Madrid's community (1,22), Estremadura (1,14), Principality of Asturias (1,06), Castile and Leon (0,95), Galicia (0,94), Cantabria (0,91) and Aragon (0,83).
For example, the spatial distribution of assassination attempts only in 2017 is the next:
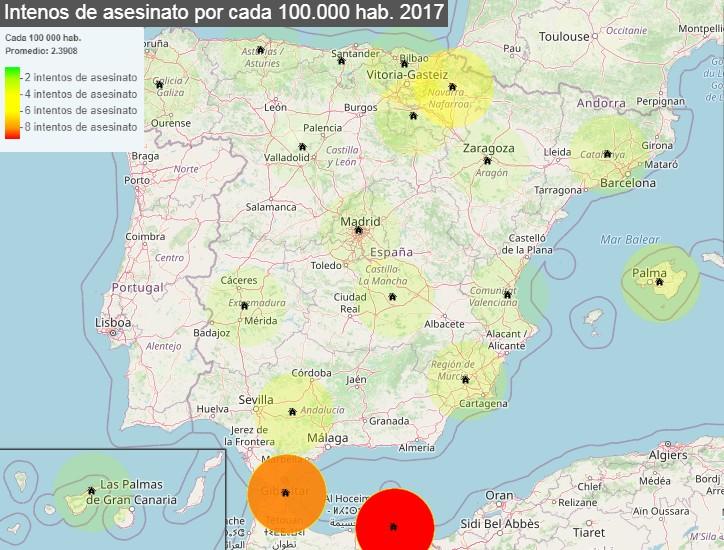
Image of the website: www.entredatos.es/mapa/crimen/espana/
Fights
Fights are serious crimes and less serious than injuries and riotous brawl, and the Penal Code (1995) collects it in book II, Page 22; Crimes against public order[7]. The total mean is 49,12 For each 100.000 population, and the median is 43,78.
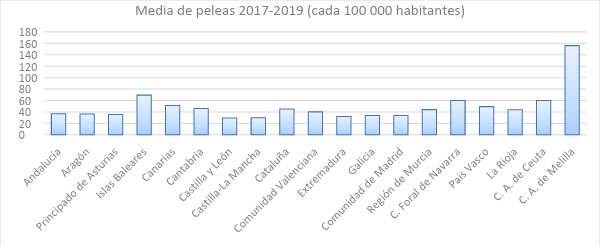
Graphic 8. Own elaboration
As in the other sections, fights in the Autonomous City of Ceuta are more numerous than in the rest of the country (half of 155,96 fights for each 100.000 population). Thus, the median will continue to be used as a reference. Also, the value to be added and subtracted to determine if a community is within or outside the average is that of 4,3.
Thus, the areas of the country with the highest rate of fights are: Autonomous City of Melilla (155,96), Autonomous City of Ceuta (60,02), Balearic Islands (69,44), Foral Community of Navarra (60,04), Canary Islands (51,13) and Basque Country (49,33). Then, Communities with an average fight rate are: Cantabria (46,22), Catalonia (44,99), Murcia region (44,09), The Rioja (43,78) and Valencian Community (40,15). Finally, the areas with the lowest fight rate are: Andalusia (36,95), Aragon (36,33), Principality of Asturias (35,69), Madrid's community (33,87), Galicia (33,78), Estremadura (32,19), Castilla la Mancha (29,99) and Castilla y León (29,27).
For example, the geographical distribution of fights in the year alone 2017 was the next:
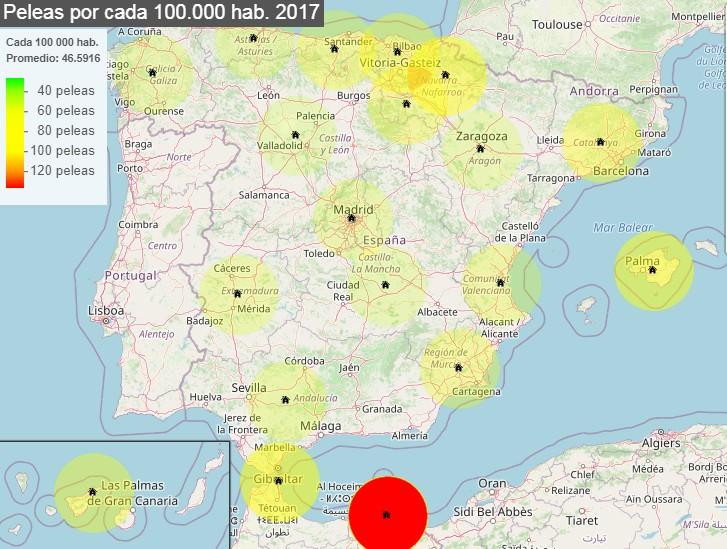
Image of the website: www.entredatos.es/mapa/crimen/espana/
Abductions
Kidnappings refer to the crime that its name indicates, and the Penal Code (1995) collects it in book II, title VI; crimes against freedom[8]. The average of the whole country during 2017, 2018 and 2019 It is 0,17 For each 100.000 population, while the median is 0,1.
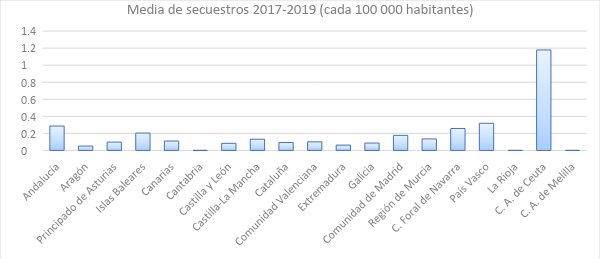
Graphic 9. Own elaboration
The Autonomous City of Ceuta has a higher average than the rest of the communities (1,17 kidnappings for each 100.000 population), so the median will be used as the reference value. Likewise, all those figures that are 0,01 above or below the average will be included in the average.
In this way, Communities with a kidnapping rate that is above average are: Autonomous City of Ceuta (1,17), Basque Country (0,31), Andalusia (0,28), Foral Community of Navarra (0,25), Balearic Islands (0,20), Madrid's community (0,17), Murcia region (0,13) and Castilla-La Mancha (0,13). The areas of the country with an average kidnapping rate are: Canary Islands (0,11), Valencian Community (0,10), Principality of Asturias (0,09) and Catalonia (0,09). To end the kidnappings, The communities with the lowest rate of this type of crime are: Aragon (0,05), Estremadura (0,06), Castile and Leon (0,08), Galicia (0,08), Autonomous City of Melilla (0), The Rioja (0) and Cantabria (0).
For example, the geographical distribution of kidnappings only for the year 2017 is the next:
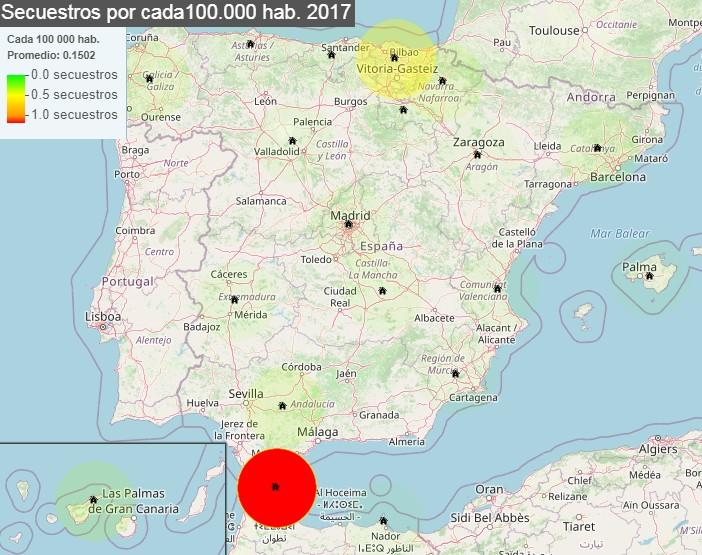
Image of the website: www.entredatos.es/mapa/crimen/espana/
SEXUAL ASSAULT WITH PENETRATION
Penetrating sexual assaults refer to the crime that the name itself indicates, and the Penal Code (1995) collects it in book II, title VIII; crimes against sexual freedom and indemnity[9]. The total mean is 3,18, while the median is 2,69.
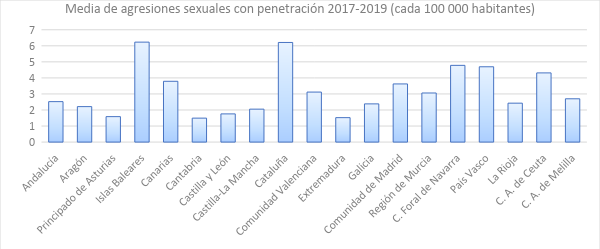
Graphic 10. Own elaboration
As you can see, there is a dispersion of the data in general, although this time it is not due to the figures of the Autonomous City of Ceuta or Melilla. Thus, the median will continue to be used as a measure, while the value that is going to be added and subtracted to determine which territories are within the average is going to be 0,26.
So that, The autonomous communities with the highest rate of penetrative sexual assaults in the country are: Balearic Islands (6,22), Catalonia (6,2), Foral Community of Navarra (4,78), Basque Country (4,69), Autonomous City of Ceuta (4,31), Canary Islands (3,78), Madrid's community (3,62), Valencian Community (3,11) and Region of Murcia (3,05). The areas of Spain with an average attack rate are: Autonomous City of Melilla (2,69), Andalusia (2,52) and La Rioja (2,42). Finally, Communities with a low rate of this type of sexual assault are: Galicia (2,38), Aragon (2,21), Castilla la Mancha (2,05), Castile and Leon (1,75), Principality of Asturias (1,58), Estremadura (1,52) and Cantabria (1,49).
For example, the spatial distribution of penetrative sexual assaults only in the year 2017 is the next:
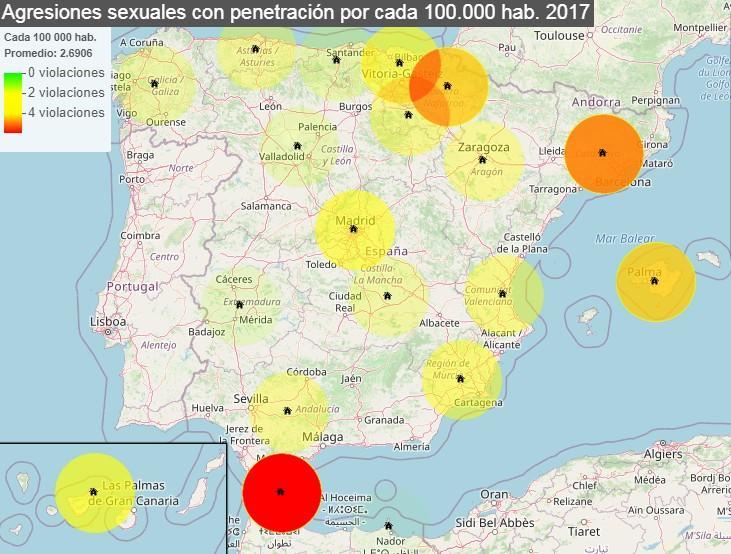
Image of the website: www.entredatos.es/mapa/crimen/espana/
SEXUAL ASSAULT WITHOUT PENETRATION
Non-penetrative sexual assaults appear in the Penal Code (1995) collects it in book II, title VIII; crimes against sexual freedom and indemnity[10]. The total mean is 25,42 For each 100.000 population, while the median is 24,99.
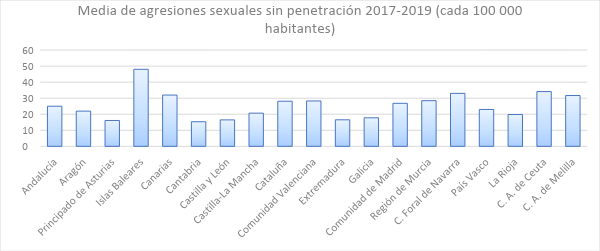
Graphic 11. Own elaboration
Mean and median are similar because, as can be seen in the graph, communities have more balanced data with each other. So that, the 25 as measurement value, while the figure that is going to be added and subtracted to determine if a community is part of the average is that of 2,5.
Therefore, the territories with the highest rate of sexual assaults (no penetration) according to their average they are: Balearic Islands (48), Autonomous City of Ceuta (34,11), Foral Community of Navarra (33,01), Canary Islands (31,96), Autonomous City of Melilla (31,66), Murcia region (28,45), Valencian Community (28,27) and Catalonia (28,1). Communities with an attack rate that falls within the average are: Andalusia (24,99) and Community of Madrid (26,8). To end sexual assaults, the territories of the country with the lowest rate of this type of crime are: Basque Country (22,9), Aragon (21,94), Castilla la Mancha (20,66), The Rioja (19,82), Galicia (17,78), Estremadura (16,52), Castile and Leon (16,48), Principality of Asturias (16,11), and Cantabria (15,33).
For example, the geographic distribution of non-penetrative sexual assaults in the year 2017 was the next:
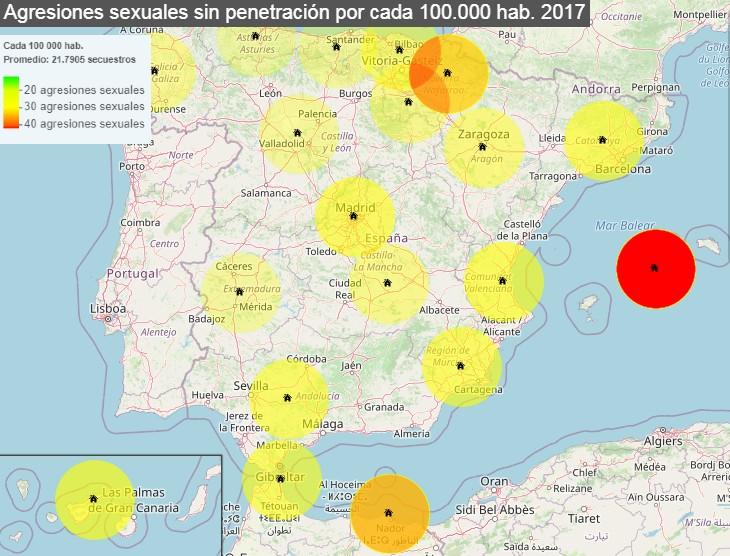
Image of the website: www.entredatos.es/mapa/crimen/espana/
THEFT WITH VIOLENCE
Robberies with violence refer to all those robberies that have been committed using violence and intimidation, and the Penal Code (1995) collects it in book II, title XIII; crimes against heritage and socioeconomic order[11]. The total mean is 107,21, while the median is 70,89.
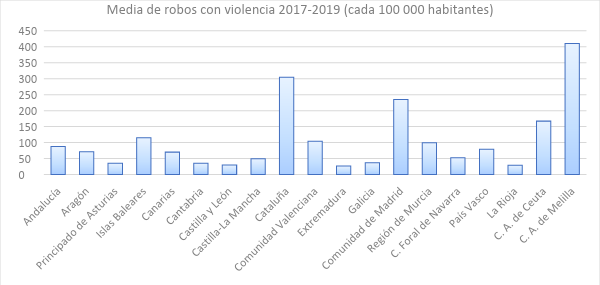
Graphic 12. Own elaboration
The mean and the median are very different because there are a few very high figures and others very low. Because of this, the median is used as a reference value. Also, to this we are going to add and subtract the amount of 7 to indicate the communities that fall within the average for Spain.
So that, the areas of Spain with a high rate of robbery with violence are: Autonomous City of Melilla (410,04), Catalonia (304,51), Madrid's community (234,97), Autonomous City of Ceuta (167,13), Balearic Islands (115,04), Valencian Community (103,96), Murcia region (99,72), Andalusia (88,03) and Basque Country (79,1). The communities that are in the average of robberies are: Aragon (70,89) and the Canary Islands (70,05). Finally, the territories with the lowest rate are: Foral Community of Navarra (52,37), Castilla la Mancha (48,92), Galicia (36,49), Cantabria (35,54), Principality of Asturias (35,48), Castile and Leon (29,69), The Rioja (28,69) and Extremadura (26,36).
For example, the spatial distribution of robberies with violence only in the year 2017 is the next:
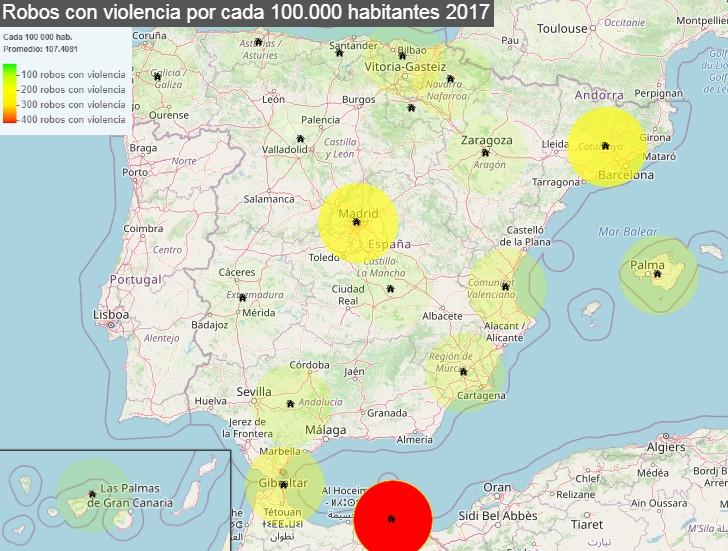
Image of the website: www.entredatos.es/mapa/crimen/espana/
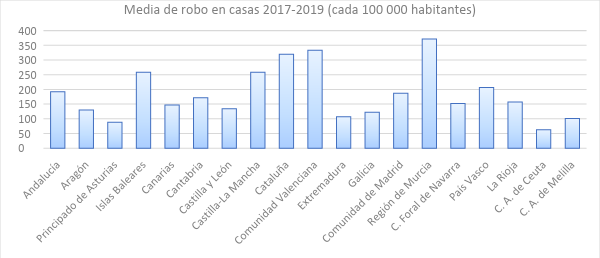
THEFT IN HOUSES
Thefts in dwellings refer to the crimes of robbery with force in homes, establishments and other facilities, and the Penal Code (1995) collects it in book II, title X; crimes against privacy, the right to one's own image and the inviolability of the home[12]. The average for the whole of Spain in the years indicated is 265,62 For each 100.000 population, while the median is 233,68.
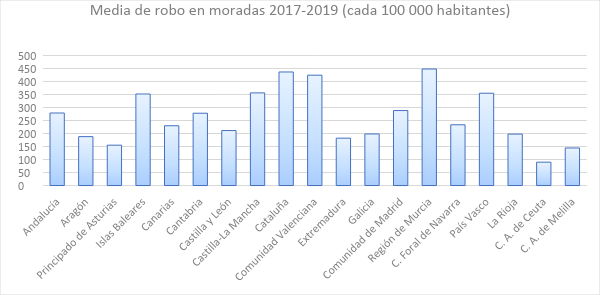
Graphic 13. Own elaboration
Because there is a notable difference between the two, the median will be used as the central measure. Likewise, this value is going to add and subtract the figure of 23,3 to observe which territories are part of the country's average.
In this way, the autonomous communities that, according to your average, have a higher rate of burglary in dwellings are: Murcia region (448,02), Catalonia (436,51), Valencian Community (424,22), Castilla la Mancha (356,18), Basque Country (354,87), Balearic Islands (351,89), Madrid's community (288,17), Andalusia (278,84) and Cantabria (277,96). The areas of the country that are within the average are: Foral Community of Navarra (233,58), Canary Islands (229,78) and Castilla y León (211,33). Finally, The communities with the lowest rate of robberies in homes and other establishments are: Galicia (198,25), The Rioja (197,85), Aragon (188,02), Estremadura (182,02), Principality of Asturias (155,12), Autonomous City of Melilla (144,43) and Autonomous City of Ceuta (89,82).
For example, the geographical distribution of the burglaries only for the year 2017 is the next:
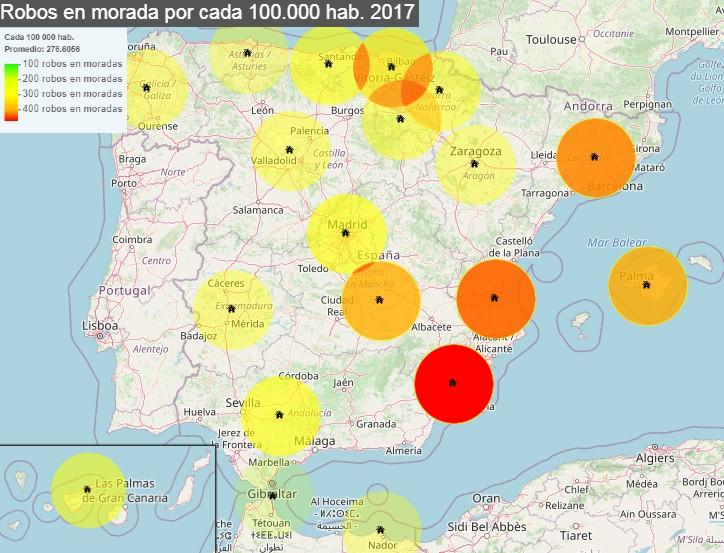
Image of the website: www.entredatos.es/mapa/crimen/espana/
THEFT IN HOUSES
Burglaries, unlike the previous paragraph, only includes crimes related to robberies with force in homes, and the Penal Code (1995) collects it in book II, title X; crimes against privacy, the right to one's own image and the inviolability of the home[13]. The total mean for each 100.000 inhabitants throughout the country is 184,06, and the median is 156,91.
Graphic 14. Own elaboration
As you can see, there is a general dispersion of the data, so the median will be used as the reference value. In the meantime, the figure to be added and subtracted from the median to determine which territories are within the mean is going to be 15,6.
In this way, The autonomous communities with the highest rate of home robberies in the country are: Murcia region (371,16), Valencian Community (332,88), Catalonia (319,98), Balearic Islands (258,59), Castilla la Mancha (258,57), Basque Country (206,13), Andalusia (191,99) and Community of Madrid (186,62). The areas of Spain that are within the average are: Cantabria (171,21), The Rioja (156,91), Foral Community of Navarra (151,55) and the Canary Islands (147,10). To end, Communities with a low home burglary rate are: Castile and Leon (133,72), Galicia (122,25), Aragon (129,62), Estremadura (107,26), Autonomous City of Melilla (100,79), Principality of Asturias (88,55) and Autonomous City of Ceuta (62,36).
For example, the spatial distribution of burglaries of the year 2017 is the next:
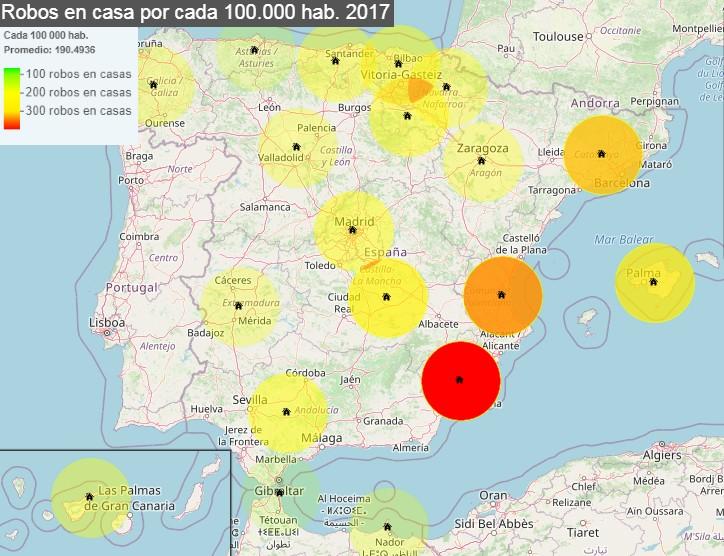
Image of the website: www.entredatos.es/mapa/crimen/espana/
HURTOS
They appear in the Penal Code (1995) in book II, title XIII; crimes against heritage and socioeconomic order[14]. The total average for the country is 1213,96, while the median is 1016,43.
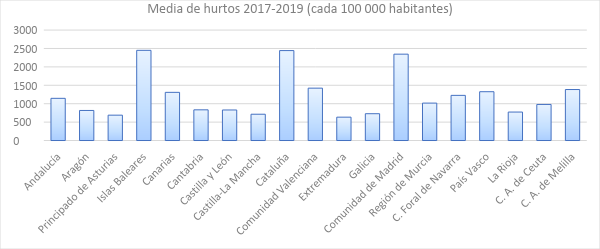
Graphic 15. Own elaboration
As in previous sections, this difference between both values is due to the dispersion of the data. Thus, the median is to be used as the central measure, to which will be added and subtracted the figure of 101,64 to identify which communities fall within the average number of thefts in Spain.
Therefore, the territories with a higher theft rate according to their average are: Balearic Islands (2449,51), Catalonia (2442,63), Madrid's community (2345,55), Valencian Community (1422,62), Autonomous City of Melilla (1384,94), Basque Country (1325,52), Canary Islands (1308,42), Foral Community of Navarra (1226,30) and Andalusia (1145,64). Communities with a theft rate within the average for the country are: Murcia region (1016,43) and Autonomous City of Ceuta (979,64). To end the thefts, the territories with the lowest index are: Cantabria (833,59), Castile and Leon (829,39), Aragon (816,63), The Rioja (773,03), Galicia (728,08), Castilla la Mancha (714,28), Principality of Asturias (688,77) and Extremadura (634,20).
For example, the geographical distribution of thefts on the map in the year 2017 is the next:
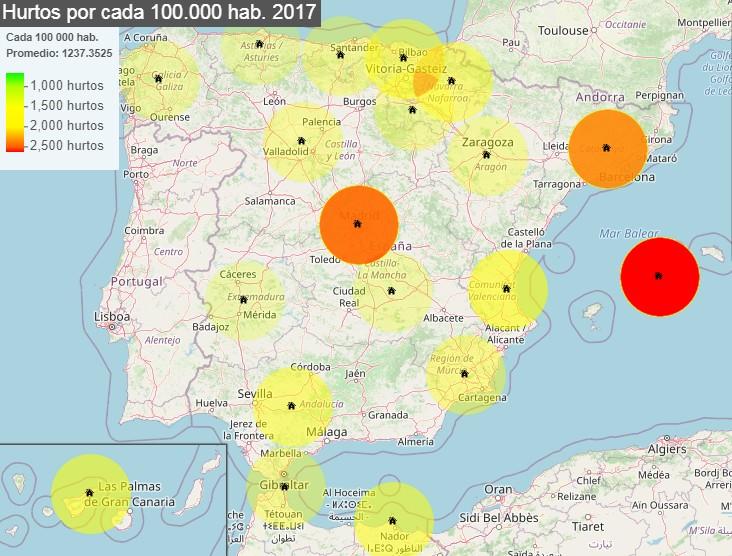
Image of the website: www.entredatos.es/mapa/crimen/espana/
VEHICLE SUBSTRACTIONS
Vehicle thefts appear in the Penal Code (1995) in book II, title XIII; crimes against heritage and socioeconomic order[15]. The average for each 100.000 inhabitants in Spain is 70,01, while the median is 41,17.
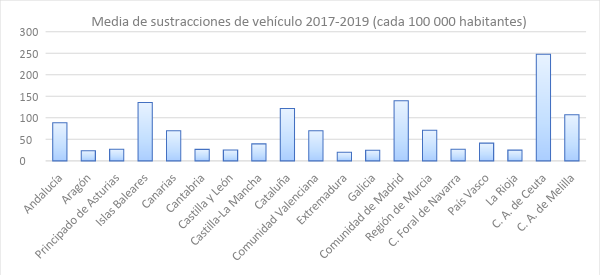
Graphic 16. Own elaboration
It can be seen that the data is scattered, being mostly very high or very low figures. Thus, the median will be used as the reference value, to which we are going to add and subtract the number of 4,1 to indicate which territories of the country are within the mean.
In this way, the territories with the highest rate of vehicle thefts are: Autonomous City of Ceuta (247,89), Madrid's community (139,48), Balearic Islands (135,65), Catalonia (121,57), Autonomous City of Melilla (106,98), Andalusia (88,31), Valencian Community (70,11), Murcia region (71,08) and the Canary Islands (69,87). Communities that are within the mean when it comes to this crime are: Foral Community of the Basque Country (41,17) and Castilla-La Mancha (39,44). Finally, The territories with the lowest rate of vehicle thefts are: Foral Community of Navarra (27,08), Principality of Asturias (27,02), Cantabria (26,70), Castile and Leon (25,20), The Rioja (24,90), Galicia (24,46), Aragon (23,48) and Extremadura (19,86).
For example, the spatial distribution of vehicle subtractions only in 2017 is the next:
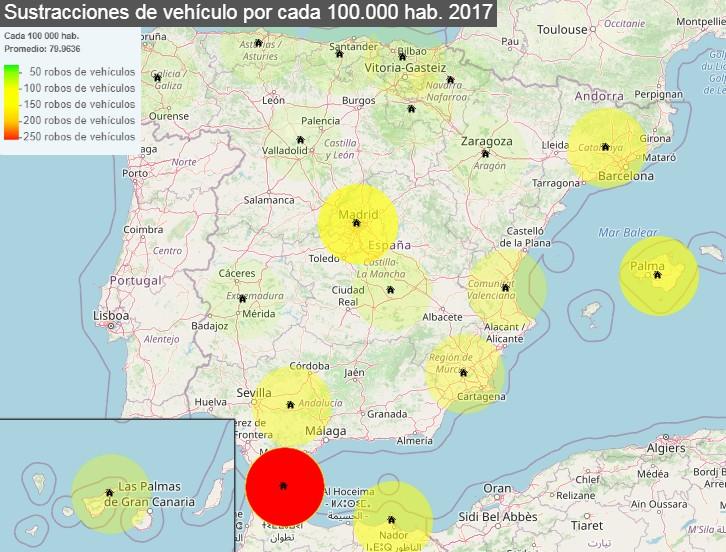
Image of the website: www.entredatos.es/mapa/crimen/espana/
DRUG TRAFFIC
Drug trafficking appears in the Penal Code (1995) collects it in book II, title XVII; of crimes against collective security[16]. The average in Spain is 40,80 crimes for each 100.000 population, while the median is 24,22.
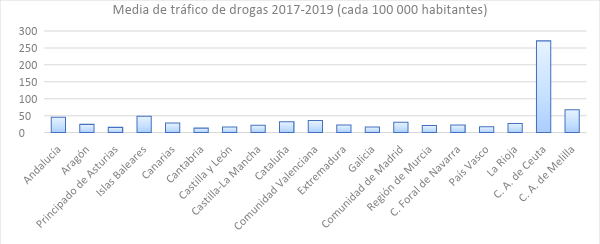
Graphic 17. Own elaboration
As you can see, the Autonomous City of Ceuta notably surpasses the rest of the communities. Because this raises the mean so much, median will be used as reference value. Also, it will be softened and the figure will be subtracted from 2,4 to determine which territories are off or on average.
The communities with the highest average crime for drug trafficking are: Autonomous City of Ceuta (270,82), Autonomous City of Melilla (67,57), Balearic Islands (48,33), Andalusia (45,36), Valencian Community (35,64), Catalonia (32,07), Madrid's community (30,27), Canary Islands (28,11) and La Rioja (27,10). The areas of the country that are in the middle are: Aragon (24,22), Estremadura (22,71), Foral Community of Navarra (22,25) and Castilla-La Mancha (21,75). Finally, Communities with a low rate of drug trafficking are: Murcia region (21,05), Basque Country (16,96), Castile and Leon (16,31), Galicia (16,18), Principality of Asturias (15,37), and Cantabria (13,20).
For example, the spatial distribution of drug trafficking for the year 2017 in Spain it is the following:
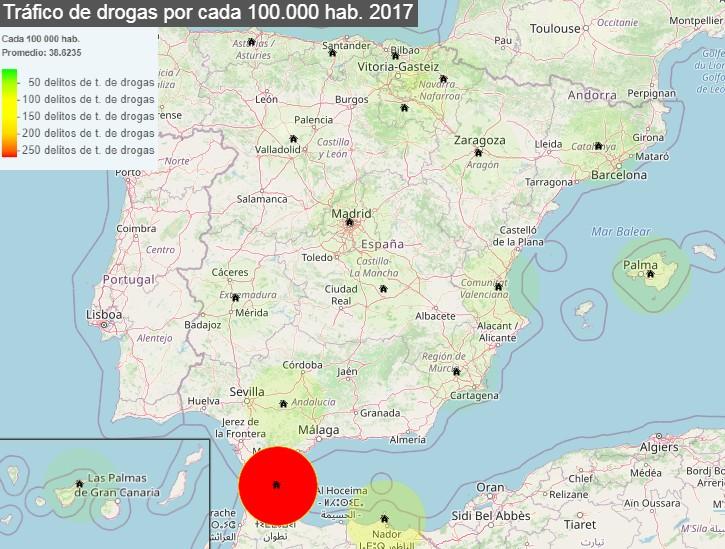
Image of the website: www.entredatos.es/mapa/crimen/espana/
RESULTS AND CONCLUSIONS OF THE SECTION
Then, The information obtained from the crime averages will be ordered and grouped for each 100.000 inhabitants to facilitate their interpretation. Thus, crime rates can be observed (alto, medium or low) who has each type of crime in a territory of Spain. In this aspect, It is important to emphasize that the rate of a crime has been determined with respect to the means of the same crime in other communities, and not with respect to the means of other crimes in the same community. On the other hand, It will also be determined if the community is part of any of the first three (nº1, 2 The 3) or last three (nº17, 18 The 19) positions in some criminal type, indicating if you have one of the highest or lowest means of any of the crimes seen.
- Andalusia: position no. 3 in kidnappings.
- High index: murders, assassination attempts, kidnappings, robbery with violence, robbery in dwellings, home robbery, thefts, vehicle theft and drug trafficking.
- Average index: penetrative sexual assaults and non-penetrative sexual assaults.
- Low index: fights.
- Aragon: position no. 19 in assassination attempts and no. 18 in vehicle thefts.
- Average index: murders, robbery with violence and drug trafficking.
- Low index: assassination attempts, fights, kidnappings, penetrative sexual assault, non-penetrative sexual assault, burglaries, house robberies, theft and theft of vehicles.
- Principality of Asturias: position no. 17 in sexual assault with penetration and robberies in dwellings and no. 18 in sexual assault without penetration, house robberies, theft and drug trafficking.
- Average index: murders and kidnappings.
- Low index: assassination attempts, fights, penetrative sexual assault, non-penetrative sexual assault, robbery with violence, burglaries, house robberies, thefts, vehicle theft and drug trafficking.
- Islas Baleares: position no. 1 in sexual assault with and without penetration and theft. Position no. 3 in assassination attempts, fights, vehicle thefts and drug trafficking.
- High index: assassination attempts, fights, kidnappings, penetrative sexual assault, non-penetrative sexual assault, robbery with violence, burglaries, house robberies, thefts, vehicle theft and drug trafficking.
- Average index: murders.
- Canary Islands: position no. 3 in murders.
- High index: murders, assassination attempts, fights, penetrative sexual assault, non-penetrative sexual assault, thefts, vehicle theft and drug trafficking.
- Average index: kidnappings, robbery with violence, burglary and burglary
- Cantabria: position no. 18 in murders and no. 19 in kidnappings, sexual assault with and without penetration and drug trafficking.
- High index: burglaries.
- Average index: murders, fights, house robberies.
- Low index: assassination attempts, kidnappings, penetrative sexual assault, non-penetrative sexual assault, robbery with violence, thefts, vehicle theft and drug trafficking.
- Castile and Leon: position no. 17 in sexual assault without penetration and robbery with violence and position nº 19 in fights.
- Average index: burglaries.
- Low index: murders, assassination attempts, fights, kidnappings, penetrative sexual assault, non-penetrative sexual assault, robbery with violence, house robberies, thefts, vehicle theft and drug trafficking.
- Castilla la Mancha: position no. 17 in thefts and number 18 in fights.
- High index: kidnappings, burglaries and burglaries.
- Average index: assassination attempts, vehicle thefts and drug trafficking.
- Low index: murders, fights, penetrative sexual assault, non-penetrative sexual assault, robbery with violence and theft.
- Catalonia: position no. 2 in penetrative sexual assault, robbery with violence, burglaries and thefts. Position no. 3 in burglaries.
- High index: murders, assassination attempts, penetrative sexual assault, non-penetrative sexual assault, robbery with violence, burglaries, house robberies, thefts, vehicle theft and drug trafficking.
- Average index: fights and kidnappings.
- Community Valencian: position no. 2 in burglaries and no. 3 in robberies in dwellings.
- High index: murders, assassination attempts, penetrative sexual assault, non-penetrative sexual assault, robbery with violence, burglaries, house robberies, thefts, vehicle theft and drug trafficking.
- Average index: fights and kidnappings.
- Estremadura: position no. 17 in fights, nº 18 in sexual assault with penetration and no. 19 in robberies with violence, thefts and thefts of vehicles.
- Average index: murders and drug trafficking.
- Low index: assassination attempts, fights, kidnappings, penetrative sexual assault, non-penetrative sexual assault, robbery with violence, burglaries, house robberies, theft and theft of vehicles.
- Galicia: position no. 17 in assassination attempts, vehicle thefts and drug trafficking.
- Low index: murders, assassination attempts, fights, kidnappings, penetrative sexual assault, non-penetrative sexual assault, robbery with violence, burglaries, house robberies, thefts, vehicle theft and drug trafficking.
- Madrid's community: position no. 2 in vehicle thefts and no. 3 in robberies with violence and theft.
- High index: kidnappings, penetrative sexual assault, robbery with violence, burglaries, house robberies, thefts, vehicle theft and drug trafficking.
- Average index: murders and sexual assault without penetration.
- Low index: assassination attempts and fights.
- Murcia region: position no. 1 in burglaries and burglaries.
- High index: murders, assassination attempts, kidnappings, penetrative sexual assault, non-penetrative sexual assault, robbery with violence, burglaries, burglaries and vehicle theft.
- Average index: fights and thefts.
- Low index: drug traffic.
- Foral Community of Navarra: position no. 2 in murders and no. 3 in sexual assaults with and without penetration.
- High index: murders, assassination attempts, fights, kidnappings, penetrative sexual assault, non-penetrative sexual assault and theft.
- Average index: burglaries, burglaries and drug trafficking.
- Low index: robbery and theft of vehicles.
- Basque Country: position no. 2 in kidnappings and number 17 in murders.
- High index: fights, kidnappings, penetrative sexual assault, robbery with violence, burglaries, burglaries and thefts.
- Average index: attempted murder and carjacking.
- Low index: murders, non-penetrative sexual assault and drug trafficking.
- The Rioja: position no. 18 in kidnappings and robberies with violence and no. 19 in murders.
- High index: drug traffic.
- Average index: assassination attempts, fights, penetrative sexual assault and home burglary.
- Low index: murders, kidnappings, non-penetrative sexual assault, robbery with violence, burglaries, theft and theft of vehicles.
- Autonomous City of Ceuta: position no. 1 in murders, assassination attempts, kidnappings, vehicle thefts and drug trafficking. Position no. 2 in fights and sexual assault without penetration. Position no. 19 in burglaries and burglaries.
- High index: murders, assassination attempts, fights, kidnappings, penetrative sexual assault, non-penetrative sexual assault, robbery with violence, vehicle theft and drug trafficking.
- Average index: thefts.
- Low index: burglaries and burglaries.
- Autonomous City of Melilla: position no. 1 in fights and robberies with violence, nº 2 in assassination attempts and drug trafficking, nº 17 in kidnappings and house robberies, nº 18 in murders and robberies in dwellings.
- High index: assassination attempts, fights, non-penetrative sexual assault, robbery with violence, thefts, vehicle theft and drug trafficking.
- Average index: penetrative sexual assault
- Low index: murders, kidnappings, burglaries and burglaries.
Regarding the position occupied by the autonomous communities in some criminal typology, it can be seen that a consistency is maintained; the territories that occupy the first positions, as usual, have a higher crime rate. Unlike, those in the bottom ranks have a lower crime rate. Also, It can be added that they are either part of one of the first three positions or one of the last three. That is to say, if the Region of Murcia is the community with the most robberies in houses and dwellings in the country, It will not be the one with the least fights (for example).
However, this does not apply to the Autonomous City of Ceuta, the Autonomous City of Melilla or the Basque Country. These territories are the only ones that occupy either one of the first three or one of the last three in any type of crime.. For example, the Basque Country stands out with one of the highest averages in kidnappings, but one of the lowest in murders. However, those that differ the most are the Autonomous Cities of Ceuta and Melilla. These rank highest in various types of crime (especially the C. A. of Ceuta), but both have the lowest ranks when it comes to burglaries and home burglaries, being the Region of Murcia, the Valencian Community and Catalonia the communities that are positioned first.
The fact of being both one of the regions that has the most crimes of one type and one of those that has the least of another type, coincides with the observation made in the previous section; the Autonomous City of Ceuta and Melilla are very inconsistent and disparate territories in terms of the information they provide on crime. However, It is not surprising that they have a behavior that differs from the rest of the communities in Spain, because its peculiarities are quite known (both geographical and social and economic). Thus, and due to the administrative need to incorporate these territories into a regional list, notable differences can be observed in the statistics with respect to the rest of the country's regions (Córdoba & Garcia, 1992).
In this way, all the areas positioned in the first positions of some type of crime belong to the communities with a high and medium total crime rate: Andalusia, Balearic Islands, Canary Islands, Catalonia, Valencian Community, Madrid's community, Region of Murcia and the Foral Community of Navarra. In these territories you can find types of crime with high rates, medium and low in all communities except the Balearic Islands, Canary Islands, Catalonia and Valencian Community, that are only high and medium. On the other hand, communities that only occupy the last positions in some type of crime have a low total crime rate: Aragon, Principality of Asturias, Cantabria, Castile and Leon, Castilla la Mancha, Estremadura, Galicia and La Rioja. In this case, communities have a combination of high rates, medium and low. However, the Principality of Asturias, Castilla y León and Extremadura have only medium and low rates, while Galicia only low. Finally there would be the Autonomous City of Ceuta, the Autonomous City of Melilla and the Basque Country. The first two territories of the country have a high crime rate, while the Basque Country is positioned with a medium crime rate.
This part of the study is carried out with data extracted from the statistics of the Ministry of the Interior and the National Institute of Statistics (OTHER). As both organizations are closely linked in their activity, it can be affirmed that the contrast of the information from these two sources is reliable. Also, the data collected will correspond only to 2017, since this is the last year for which statistics are available on some of the factors to be analyzed. Likewise, the calculations in this section will only be carried out with the crimes for each 100.000 inhabitants of the year 2017.
In this way, a correlation study between crimes and various factors of each autonomous community will be carried out; aging index, percentage of foreigners, tourism, PIB per cápita, average annual income, at-risk-of-poverty rate, unemployment rate, education level, drop out of education, spending on education, spending on culture and social work units. This will check if there is a direct relationship, inverse or there is no relationship between the variables. Later, and taking into account the results obtained, the corresponding bar graph will be interpreted.
AGING OF THE POPULATION
First, a correlation study will be carried out to find out if the aging of the population influences criminal activity in a territory. The dependent variable (and) are the crimes for each 100.000 population, while the independent (x) is the aging index[17]. Thus, the following values are obtained:
- Correlation coefficient: 0,68
- Determination coefficient: 0,47
- P-value: 0,001
- x = 1600,03 – 5 * and
Because the correlation coefficient is closer to 1 what to 0, it can be said that the relationship between the variables is moderately strong. On the other hand, the coefficient of determination shows that the aging index explains the 47% of criminal activity. Finally, p-value is less than 0,05, so there is a statistically significant relationship between both variables.
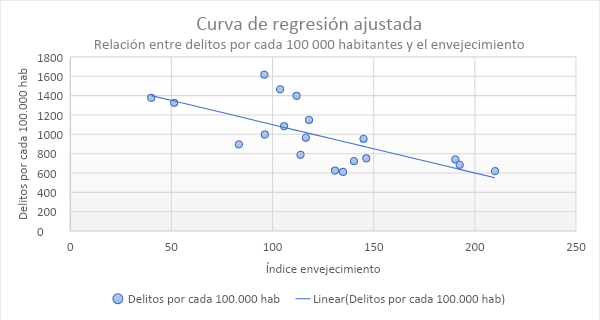
Graphic 18. Own elaboration
The graph shows a decreasing regression line. This indicates that, the higher the rate of aging of the population, fewer crimes committed for each 100.000 population. Definitely, the values indicate that both variables are linked, although not enough to explain to the 100%.
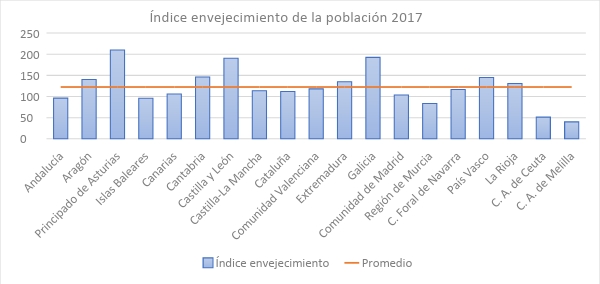
Graphic 19. Own elaboration
Through observing the bar graph and, taking into account the inverse relationship between the variables, It can be seen that some of the areas that are above the national aging average have a medium or low crime rate (Principality of Asturias, Castile and León or Galicia, for example). On the contrary, areas with less aging populations experience higher crime rates (Balearic Islands, Community of Madrid or the Autonomous Cities of Ceuta and Melilla).
FOREIGN POPULATION
The following correlation study adopts crimes for each 100.000 inhabitants as a dependent variable (and) and the percentage of foreigners as an independent variable (x)[18]. So that, these values are obtained:
- Correlation coefficient: 0,73
- Determination coefficient: 0,53
- P-value: 0,0003
- x = 482,96 + 55,34 * and
The first value indicates a relationship and the coefficient of determination states that the model explains a 53% of the data. Finally, the p-value is much lower than 0,05, so there is a significant statistical relationship between the variables.
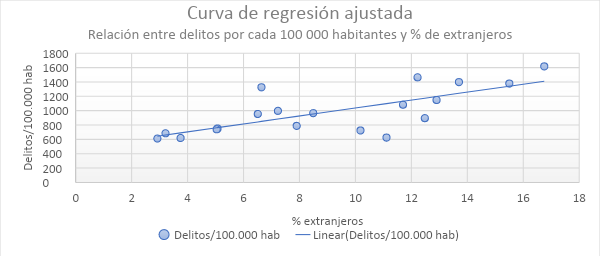
Graphic 20. Own elaboration
The increasing regression line indicates that the more foreigners there are in a territory, the more crimes are committed, thus existing a significant direct relationship, although not total, between both variables.
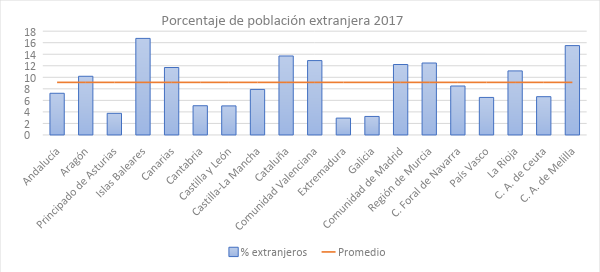
Graphic 21. Own elaboration
Then, the bar graph confirms that some of the communities with a higher percentage of immigrants coincide with those with the highest crime rates, as Balearic Islands, Catalonia or the Community of Madrid. On the contrary, some of the territories with the least immigration have the least crime, as Principality of Asturias, Extremadura or Galicia. However, It should be noted that Aragon and La Rioja also have more foreigners than the national average despite being communities with a medium-low crime rate..
TOURISM
The correlation study uses crimes for each 100.000 inhabitants as a dependent variable (and) and the number of tourists as an independent variable (x)[19]. It should be mentioned that tourism data is not converted to each 100.000 population, since this factor is considered to be more related to the type of leisure that can be done in the destination place than to its population. However, it is convenient to take into account the extension of each territory when interpreting the results. Also, add that the Autonomous Cities of Ceuta and Melilla do not appear in the INE database for this section, so they will not be taken into account. In this way, the following values are obtained:
- Correlation coefficient: 0,8
- Determination coefficient: 0,62
- P-value: 0,0001
- x = 756,6 + 3,91 * and
The first data indicates that there is a strong relationship between the variables, it is quite close to 1. Also, the coefficient of determination shows that tourism data explain up to a 62% of crimes committed by each 100.000 population. Regarding the p-value, this is much less than 0,05. Thus, variables are statistically significantly related.
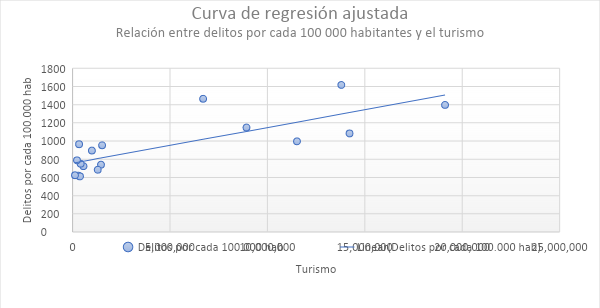
Graphic 22. Own elaboration
The regression line is increasing, indicating that when there is more tourism in a territory, more crimes are committed. Taking into account this direct relationship and the previously obtained values, it can be said that there is a fairly strong connection between the variables.
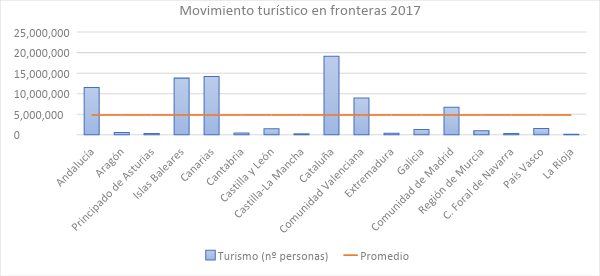
Graphic 23. Own elaboration
The bar graph indicates that almost all the communities that are above the average number of tourists per year have the highest crime rates. (Balearic Islands, Catalonia or Community of Madrid). On the other hand, the communities where there is a proven lower crime rate, They are the ones with the least tourism (Principality of Asturias, Cantabria or Extremadura). From what has been observed, criminal activity in Spain increases considerably in areas washed by the Mediterranean coast (except the capital). In the same way, it is common for coastal areas with a warm climate to attract a greater number of tourists. Thus, no wonder both variables are related.
START PER CÁPITA
The following correlation analysis collects crimes for each 100.000 inhabitants as a dependent variable (and) and the GDP per capita of each autonomous community as an independent variable (x)[20]. The results are the following:
- Correlation coefficient: 0,25
- Determination coefficient: 0,06
- P-value: 0,28
- x = 590,72 + 0,01 * and
As you can see, the correlation coefficient indicates that the relationship between both variables is weak, since the value is close to 0. Also, the coefficient of determination shows that the model only explains a 0,6% of the data. In the same way, the p-value is considerably greater than 0,05, Therefore, there is no statistically relevant relationship between the crimes committed and the GDP per capita of the autonomous communities.
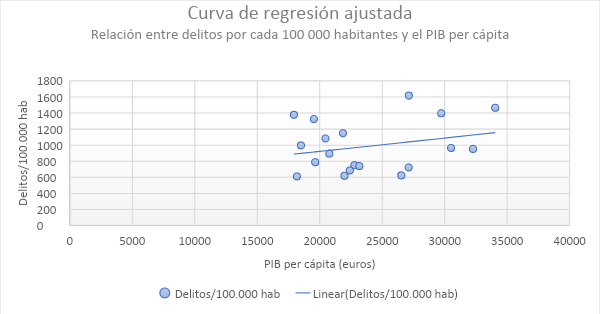
Graphic 24. Own elaboration
The regression line is increasing, which would indicate a direct relationship between x and y. However, the results show that the connection between the variables is almost non-existent, Therefore, it can be said that the GDP of each community is not capable of effectively explaining crime.
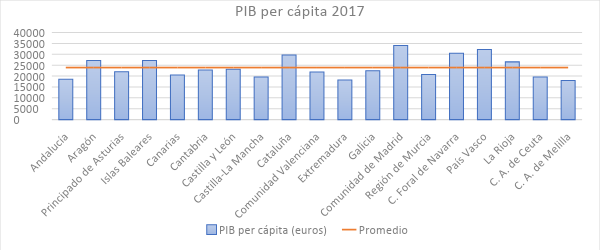
Graphic 25. Own elaboration
For his part, the bar graph shows that the territories with a GDP above the average are both those with a high crime rate (Balearic Islands or Catalonia) such as those with a medium or low index (Aragon or La Rioja). Definitely, there is no relationship between these two factors.
AVERAGE ANNUAL HOUSEHOLD INCOME
The following correlation study establishes the crimes for each 100.000 inhabitants as a dependent variable (and) and the average annual income of households as an independent variable (x)[21]. The values obtained are shown below:
- Correlation coefficient: 0,5
- Determination coefficient: 0,25
- P-value: 0,02
- x = -71,1 + 0,03 * and
The first data indicates that there is a median relationship between the variables, although this is relatively weak being in the middle of the 0 and from 1. Also, the coefficient of determination shows that tourism data would only explain a 25% of crimes committed by each 100.000 population. Regarding the p-value, this is less than 005. Thus, the variables are statistically significantly related.
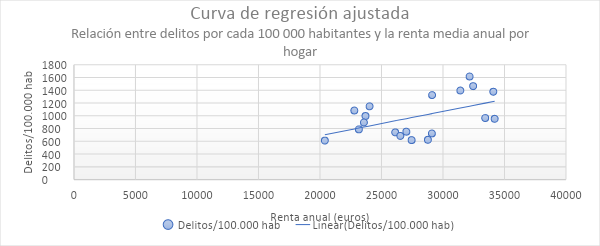
Graphic 26. Own elaboration
The regression line is increasing, which shows a direct relationship between both variables. That is to say, the higher the number of average annual income, greater number of crimes. However, the connection between the two factors is not strong enough to validate the explanation of the crime through income. Also, It is interesting to add that on numerous occasions a relationship between crime and poverty has been established. Thus, if the connection between the variables was stronger, it would be an interesting topic to analyze in greater depth due to the contradiction that.
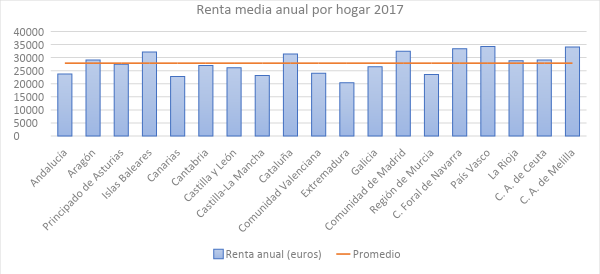
Graphic 27. Own elaboration
As can be seen in the bar chart, Communities with an annual income above the average are both those with high crime rates (Autonomous City of Ceuta and Autonomous City of Melilla) like those that have a medium or low crime (Glass Country or La Rioja). In the same way, there are areas with both high and low crime rates whose income is below average (Valencian Community or Extremadura). In summary, mean annual income does not have a strong enough relationship with criminal activity to be explanatory.
POVERTY RISK
This correlation analysis adopts crimes for each 100.000 inhabitants as a dependent variable (and) and the at-risk-of-poverty rate for each territory as an independent variable (x)[22]. It is noteworthy to mention that the risk of poverty has been calculated by the INE from the average annual income of the previous year. The results obtained are the following:
- Correlation coefficient: 0,14
- Determination coefficient: 0,01
- P-value: 0,56
- x = 883,27 + 4,94 * and
The correlation coefficient indicates that the relationship between the risk of poverty and crime is very weak. Also, the coefficient of determination shows that the model only explains the 0,01% of the data. That is to say, practically does not explain any data. For his part, p-value is greater than 0,05, therefore, there is no statistically relevant relationship between the variables.
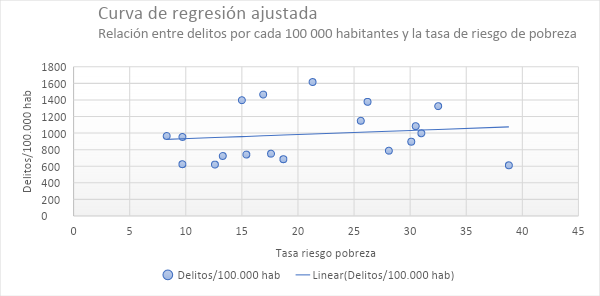
Graphic 28. Own elaboration
The regression line is increasing, which would indicate a direct relationship between x and y. However, the connection between both variables is extremely weak, so this has no relevance.
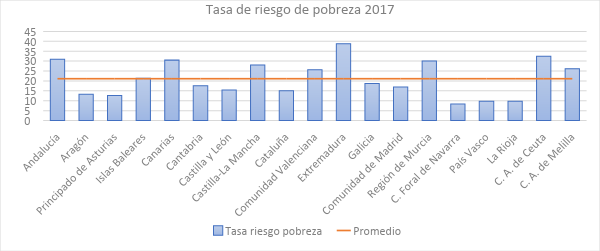
Graphic 29. Own elaboration
The bar graph allows identifying territories in the country with a low risk of poverty rate, but with a high crime (Catalonia or Autonomous City of Ceuta), or with a high risk rate, but low crime (Estremadura). That is to say, the relationship between the variables is practically non-existent in this case.
UNEMPLOYMENT
This correlation study presents crimes for each 100.000 inhabitants as a dependent variable (and) and the unemployment rate as an independent variable (x)[23]. The data will be relative to the population that is between the 25 and the 64 year old. So that, the values obtained are the following:
- Correlation coefficient: 0,05
- Determination coefficient: 0,003
- P-value: 0,82
- x = 934,29 + 3,43 * and
As can be seen with the first data, the relationship between the variables is practically nil, and the coefficient of determination indicates that unemployment explains only a 0,03% of crime. Likewise, the p-value is much greater than 0,05, Therefore, it is confirmed that there is no statistically relevant relationship between the variables.
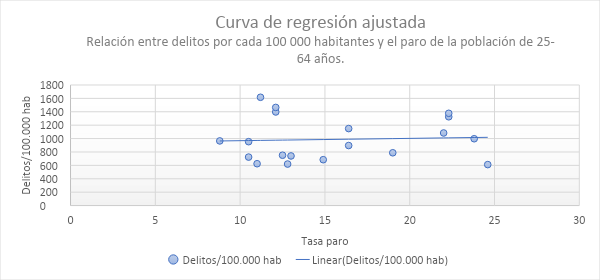
Graphic 30. Own elaboration
The regression line is slightly increasing. However, because there is no relationship between the population that is unemployed in each autonomous community and the crimes that are committed in it, this graph is not taken into account.
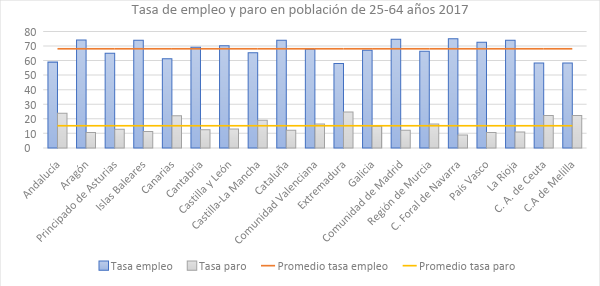
Graphic 31. Own elaboration
In this case, the bar graph shows both the employment and unemployment rates. First, It can be seen that there are communities that are below the average unemployment rate and that have both a high and low crime rate (Community of Madrid or Asturias). The same occurs with areas that are above the unemployment average., because there are some communities with a high crime rate (Autonomous City of Ceuta) and others with a low index (Estremadura). Also, the same happens with the employment rate, which means that there is no significant relationship between this and crime.
EDUCATION LEVEL
The analysis of this section is carried out through a multiple correlation study, establishing the crimes for each 100.000 inhabitants as a dependent variable (and). The independent variables (x) are the following; index of the population with the first stage of secondary school completed (x1), Population index with completed upper secondary school (x2) and index of the population with higher education (x3)[24]. Also, It should be emphasized that the data are relative to the population that is among the 25 and 64 year old. In this way, The results are the following:
- Correlation coefficient: 0,62
- R2 tight: 0,26
- P-value of x1: 0,03
- P-value of x2: 0,04
- P-value of x3: 0,03
- Ŷ = 237299,71 – 2376,84 * x1 – 2314,61 * x2 – 2376,32 * x3
First, the correlation coefficient indicates that the relationship between the variables is moderately strong, it is closer to 1 that to 0. On the other hand, el R2 adjusted shows that the model only explains a 26% of the data, which is little, well there is a 74% unexplained data. In the case of multiple regression, the coefficient of determination is not observed because it tends to increase when there are several independent variables, so the R is taken into account2 tight. Finally, the p-value of all independent variables is less than 0,05, so we can see that there is a statistically significant relationship between them.
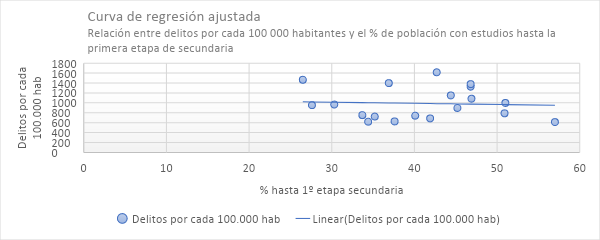
Graphic 32. Own elaboration
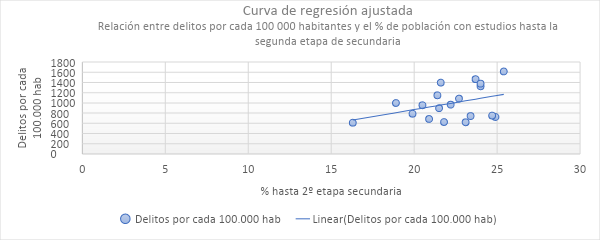
Graphic 33. Own elaboration
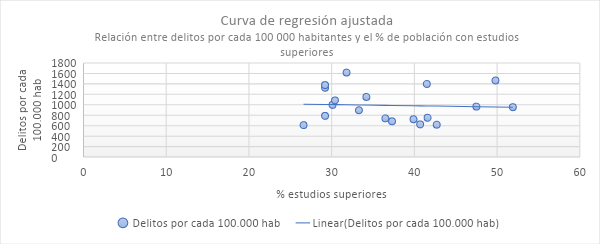
Graphic 34. Own elaboration
The graph relative to the population with studies up to the first stage of secondary school is slightly decreasing, which would indicate that the greater number of people who have up to the first stage of secondary, less crime. The figure relating to the population with studies up to the second stage of secondary school is growing and shows that, more people with studies up to the second stage of secondary school, more crimes. Finally, the reference to the population with higher education is slightly decreasing, so how many more people there are with higher education, less crime. Definitely, there is a not very strong relationship between the variables, getting to explain only one 26% of the data.
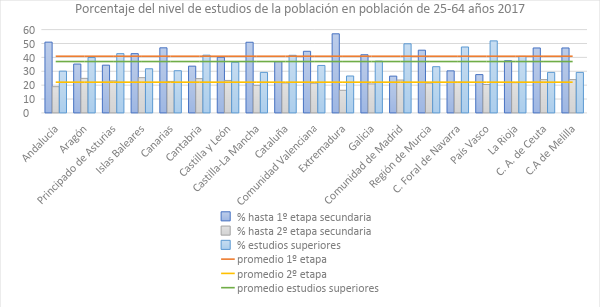
Graphic 35. Own elaboration
As can be seen in the bar graph, the highest national average is that of people who have up to the first stage of secondary school, followed by the average of higher education and ending with the average of people who have studies up to the second stage. However, there is no clear relationship between the level of studies and the crimes committed in the autonomous community.
EARLY WITHDRAWAL FROM EDUCATION
Continuing the field of education, the following correlation analysis adopts crimes for each 100.000 inhabitants as a dependent variable (and) and the rate of early school leaving as an independent variable (x)[25]. It should be noted that the dropout rate data are relative to the population that has between 18 and 24 year old. Thus, The results are the following:
- Correlation coefficient: 0,41
- Determination coefficient: 0,17
- P-value: 0,07
- x = 567 + 23,96 * and
The correlation coefficient indicates that there is a weak relationship between the variables x and y, it is closer to 0 what to 1. The coefficient of determination shows that early school leaving only explains a 17% of crime, quite a low percentage. Also, p-value is greater than 0,05, so the variables do not have a statistically significant relationship.
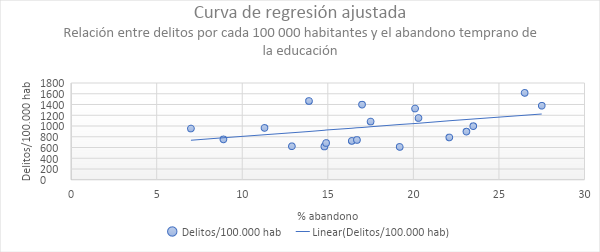
Graphic 36. Own elaboration
The regression line is increasing, which would indicate that when more dropouts from education there are, more crimes are committed. However, there is not enough relationship between the variables to accept this model, so the graph is not relevant.
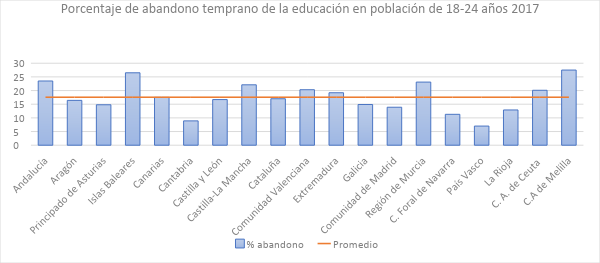
Graphic 37. Own elaboration
The bar graph shows that both communities with high and low crime rates may be above the average dropout rate. (Balearic Islands or Castilla-la Mancha, for example). Likewise, they can also be below (Cantabria or Community of Madrid). Definitely, It is not confirmed that the rate of early school leaving explains the criminal activity of an autonomous community.
PUBLIC SPENDING ON EDUCATION
To end with the educational field, a correlation study is carried out that collects crimes for each 100.000 inhabitants as a dependent variable (and) and spending on education for each 100.000 inhabitants as a dependent variable (x)[26]. The values obtained are:
- Correlation coefficient: 0,45
- Determination coefficient: 0,20
- P-value: 0,05
- x = 1433,16 – 5,14 * and
The correlation coefficient denotes a weak relationship between the variables x and y, it is even lower than 0,5. Also, the coefficient of determination indicates that spending on education explains only a 20% of crimes. For his part, the p-value is 0,05, so there would be a statistically relevant relationship.
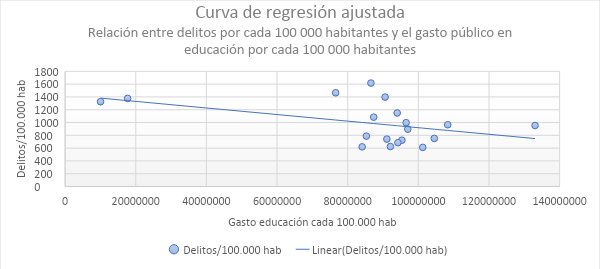
Graphic 38. Own elaboration
The regression line is decreasing, indicating an inverse relationship between x and y. That is to say, higher spending on education by autonomous community, lower commission of crimes. However, the values obtained in the study show an insufficient connection between the variables, so this model is not accepted.
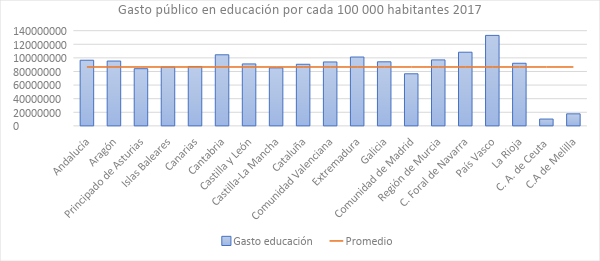
Graphic 39. Own elaboration
The bar graph shows slightly that communities with a lower crime rate are more likely to invest in education than communities with more crime. For example, Cantabria or the Basque Country have higher spending than Catalonia or the Valencian Community. However, this is not enough, since the correlation study determines that spending on education is not capable of adequately explaining crime.
PUBLIC SPENDING ON CULTURE
The following correlation analysis will take crimes for each 100.000 inhabitants as a dependent variable (and) and public spending on culture for each 100.000 inhabitants as an independent variable (x)[27]. The values are as follows:
- Correlation coefficient: 0,23
- Determination coefficient: 0,05
- P-value: 0,33
- x = 890,08 + 3,05 * and
The first data indicates a very weak relationship between spending on culture and crimes by autonomous community. Also, the coefficient of determination shows that the model is barely able to explain a 0,5% of the data. To this, it should be added that the p-value is considerably higher than 0,05, so there is no statistically significant relationship between x and y.
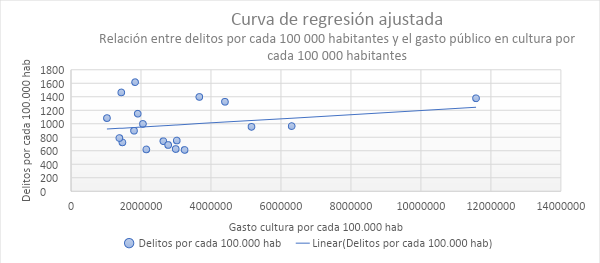
Graphic 40. Own elaboration
The regression line is increasing, which would mean that, the higher spending on culture, highest commission of crimes. However, This is denied because the data show that there is no relationship between cultural spending for each 100.000 inhabitants and crimes committed by each 100.000 population.
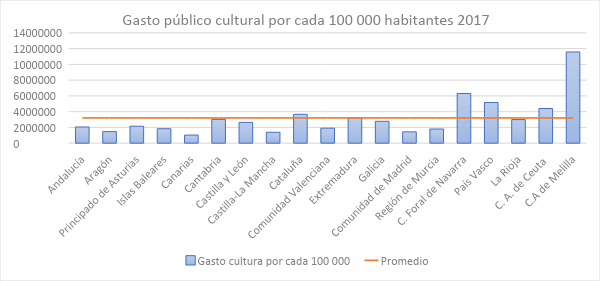
Graphic 41. Own elaboration
Like the correlation study, the bar chart does not show at first glance any type of relationship between spending on culture and crimes committed. Territories with a high crime rate, like the city of Melilla, have spending on culture above the average. Likewise, so do other communities with a medium-low index, such as the Foral Community of Navarra or the Basque Country.
SOCIAL WORK UNITS
The Social Work Unit (UTS) It is any administrative and territorial unit whose main function is to assist citizens in their access to Social Services, especially through an Information and Guidance Service. It is the most basic level of the Public Social Services System and carries out the following activities: promotional and awareness actions, systematic studies of the social needs of the population and technical cooperation in comprehensive programs of promotion and social insertion.
So that, This correlation analysis collects crimes for each 100.000 inhabitants as a dependent variable (x) and the Social Work Units for each 100.000 inhabitants as an independent variable (and)[28]. It is important to add that this section does not contain data for either the Navarra Regional Government or the Basque Country because they have a special economic regime. In this way, the values obtained are the following:
- Correlation coefficient: 0,66
- Determination coefficient: 0,44
- P-value: 0,03
- x = 1268,37 – 26,95 * and
The correlation coefficient indicates that there is a moderately strong relationship between the variables. On the other hand, the coefficient of determination shows that the social work units explain the crimes committed in a 44%, a little less than half. The p-value is less than 0,05, so it can be said that there is a statistically significant relationship of x and y.
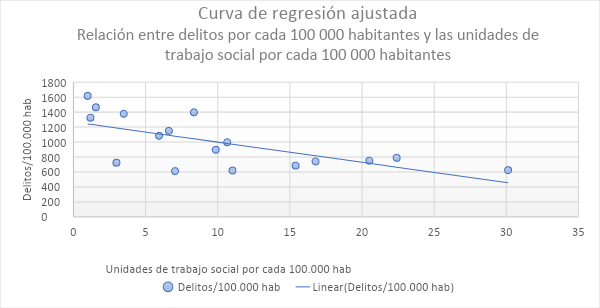
Graphic 42. Own elaboration
The regression line is decreasing, showing an inverse relationship between the variables. That is to say, the greater the number of social work units, less crime. This model can be accepted, although with caution. There is a relationship between x and y, but this is not excessively strong. Thus, more studies in the field of social work would be advisable.
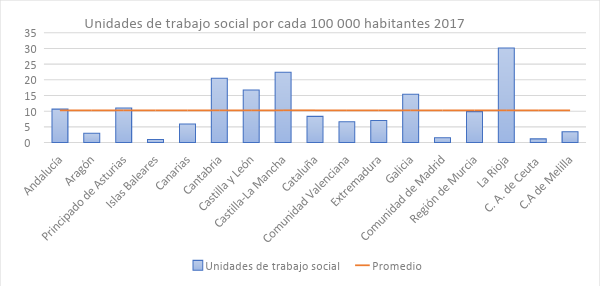
Graphic 43. Own elaboration
The bar graph shows that, effectively, several of the communities with the lowest crime rate are those that are above the average in social work units (Castile and Leon, Castilla-La Mancha and La Rioja, for example). On the contrary, communities with the highest crime rates are below average (Catalonia, Valencian Community or Community of Madrid).
RESULTS AND CONCLUSIONS OF THE SECTION
The correlation study has shown that the factors that are related, to a greater or lesser extent, with the number of crimes committed by each 100.000 population, son: aging population, foreign population, tourism, educational level and social work units.
Out of these, the most explanatory element of crime is tourism. There is a strong and direct relationship between both variables, with a correlation coefficient of 0,8 and with an explanation of the 62% of the data. According to studies done on the matter, tourism can have a double effect on crime. First, tourism activity generates greater job opportunities and higher wages than in other sectors, which means a higher opportunity cost for the commission of crimes. However, it also creates new opportunities for criminals (Gould, Mustard & Weinberg, 2002). For example, it is common for tourists to carry cash or valuables with them. If to this is added a more passive and careless attitude than the residents of the area, the result is that they become an attractive target for the criminal (Maxfield, 1987). It is also possible that tourists are the perpetrators and not the victims. This is because, not being in your usual environment, they change their behavior to one that is more uninhibited and with a lower degree of responsibility. Also, this may increase if the tourist destination is related to environments in which alcohol and drugs are present (Sharpley, 1994).
The second most influential factor in criminal activity is the foreign population. It presents a correlation coefficient of 0,73 and it can be said that the model explains a 53% of the data. Thus, and according to the results of this study, how much more immigration, more crime. However, Several authors are beginning to discover that immigration and crime have a negative relationship. Alonso-Borrego, Garoupa and Vázquez (2012) carried out a study on the link between these two variables, with an exhaustive approach and supported by economic analysis. They observed that, during strong immigration years, Spain saw its crime grow at a rate similar to that of population growth (the growth of crime and the foreign population were explained by 50%). Although Spain was the recipient of more foreigners than other European countries, crime growth was lower than in places with fewer immigrants. This also happened in other countries of the world, Therefore, elements were found that show that the increase in foreigners prevents crime rates from also increasing. (and which should be taken into account when conducting studies). These factors can be education or gender, This does not mean that there are no groups of immigrants with a lower educational level that contribute to the growth of crime..
In the same way, Garcia Spain (2019) affirms that more and more investigations recognize that there is less crime in countries with a larger immigrant population. Foreigners tend to have a lower crime rate than nationals and are more resistant to crime in disorganized contexts. However, since crime is a multi-causal phenomenon and the criminal activity of immigrants is very diverse, it would be inappropriate to say that these variables are fully explained without taking into account other conditioning factors analyzed by empirical research.
Continuing with the correlation study carried out in this work, it has been observed that the aging of the population occupies the third position of the determinants of crime. The model shows an inverse relationship, with a correlation coefficient of 0,68 and an explanation of the 47% of the data. This means that, if a community has a higher rate of aging, it also has a lower crime rate. Thus, one might venture that young people commit more crimes than older people. If the data of convicted adults are consulted in 2017 provided by the INE[29], it is observed that the 8,97% of condemned had of 18 a 20 years, he 14,66% of 21 a 25 years, he 14,46% of 26 a 30 years, he 14,65% of 31 a 35 years, he 14,20% of 36 a 40 years, he 20,34% of 41 a 50 years, he 8,91% of 51 a 60 years, he 2,87% of 61 a 70 years and the 0,89% had more than 71 years. As you can appreciate, he 66,94% of detainees is among the 18 and 40 year old. After, a peak occurs between 41 and the 50 and, Finally, the number of convicts begins to decrease drastically in ages of more than 50 years. In addition to these data, It must also be taken into account that there is a figure for juvenile delinquency: “It begins around the 13/14 years, begins to decline in late adolescence (18 years), it is done in the company of others and the most frequent behaviors continue to be alcohol consumption, shoplifting, the fights and vandalism " (Fernandez, Bartolomé, Rechea & Megías, 2009).
The fourth place belongs to the Social Work Units (UTS) as far as determining factors of crime are concerned. The correlation coefficient is 0,66 and it is indicated that the variable explains a 44% of crime in the autonomous communities. The relationship that has been established is inverse, that is to say, the higher the number of UTS, lower crime rate. As it mentioned above, These are the administrative units whose essential function is to assist citizens in their access to Social Services, thus forming the most basic level of this structure of the Public System. As they are only the most basic level, the scope of Social Work is much more extensive and the investment of the State in this matter is also. As Pastor indicates (2001), social initiative entities have become one of the most important elements in the Welfare Society. Also, multiculturalism due to immigration requires action in socio-labor integration and care for citizens without a family nucleus or coexistence.
Although Social Work does not consist directly in the prevention and treatment of crime like Criminology, their work does affect and improve the quality of life of the population that may present risk factors for criminal behavior. Thus, it would be convenient to carry out in-depth studies in this matter, thus finding out if there really is an inverse relationship between social work and the crime rate.
To end, educational level is the last factor that has presented a certain relationship with crime. The correlation coefficient is 0,62, although this variable can only explain a 26% of crime. Thus, it cannot be said that both variables are explained effectively. However, perhaps the determining factor is not the level of education of the population, but the quality of education itself. A study from the University of Cádiz, carried out by Ruiz-Morales (2018), encompasses this unknown. This calculates the correlation between crimes in the autonomous communities and educational quality according to the PISA Report (a global education evaluation system). Likewise, the correlation between crime and the population's education level is also calculated. The results of the study regarding educational quality show that it has a strong degree of inverse relationship with crime. That is to say, the higher the quality of education, lower crime. However, and just like in this job, the results of the correlation study regarding the level of education do not indicate a relationship, thus contradicting the empirical literature on the subject.
Regarding the rest of the factors, no significant relationship could be found between the variables. The one that comes closest to explaining crime is the average annual income per household, with a correlation coefficient of 0,5 and with an explanation of the 25% of the data. However, this relationship is considered too weak to accept the predictive value of the model. Thus, economic or employment variables are not able to explain the crime rate effectively (PIB per cápita, average annual household income, at-risk-of-poverty rate and unemployment rate). This coincides with the study by Rodríguez Andrés (2003), the results of which determine that demographic variables seem to have a greater impact than socio-economic variables in explaining crime levels.
Likewise, The variables chosen in the field of education are not decisive either (index of educational level and public spending on education) or in the culture (public spending on culture). On this last case, It is possible that it is more revealing to choose the average per capita expenditure on cultural activities than the state public expenditure on culture. However, this possibility is left for possible future research.
Once the three analysis sections have been completed, the most relevant and significant results obtained will be gathered. It should be noted that both the average of total crimes and the average of each type of crime correspond to the years 2017, 2018 and 2019. However, the data of the explanatory factors of crime only correspond to the year 2017, since this is the last year for which information was available in some databases of the INE and the Ministry of the Interior. Once this is cleared, the results by autonomous community are as follows:
The autonomous community of Andalusia has an annual average of crimes within the national average, with a figure of 1000,33 crimes for each 100.000 population. It is part of the areas of Spain whose crime rate has been more stable over the years 2017, 2018 and 2019. Likewise, all four quarters of each year experience a very similar crime rate, which increases slightly during the third trimester (July, August and september). With regard to criminal typologies, has a high murder rate, assassination attempts, kidnappings, robbery with violence, robbery in dwellings, home robbery, thefts, vehicle theft and drug trafficking. A medium rate of penetrative sexual assault and non-penetrative sexual assault, and a low rate on fights. Also, It is noteworthy that it is the third community with the most kidnappings in Spain. Finally, these are the results on the determinants of crime:
- Population aging index: below average, with a 96,21%.
- Foreigners index: above average, with a 7,23% of the total population.
- Tourist movements registered at borders: above average, with a total of 11.518.262 people.
- Social Work Units: within the average, with a total of 893 UTS (10,65 For each 100.000 population).
Aragon has a low average annual crime rate, well present 774,34 crimes for each 100.000 population. However, belongs to the areas of the country where crime has increased the most since 2017 a 2019. All quarters have mixed crime over the three years, although it stands out that the rate is lower in the third quarter than in the fourth. Regarding the criminal typologies, has an average murder rate, robbery with violence and drug trafficking, and a low rate of assassination attempts, fights, kidnappings, penetrative sexual assault, non-penetrative sexual assault, burglaries, house robberies, theft and theft of vehicles. Also, It is noteworthy that it is the country with the fewest assassination attempts and the second with the fewest vehicle thefts. By last, these are the figures of the determinants of crime:
- Population aging index: above average, with a 140,25%.
- Foreigners index: above average, with a 10,18% of the total population.
- Tourist movements registered at borders: below average, with a total of 562.352 people.
- Social Work Units: below average, with a total of 39 UTS (2,97 For each 100.000 population).
The Principality of Asturias has a low average annual crime rate, with a figure of 643,02 crimes for each 100.000 population. Also, is one of the communities whose crime rate has remained more stable since the year 2017 al 2019, which also remains stable during the quarters of the year. Regarding the criminal typologies, has an average murder and kidnapping rate, and a low rate of assassination attempts, fights, penetrative sexual assault, non-penetrative sexual assault, robbery with violence, burglaries, house robberies, thefts, vehicle theft and drug trafficking. Also, It is noteworthy that it is the third community in the country with the least penetrative sexual assaults and robberies in homes, as well as the second with fewer sexual assaults without penetration, house robberies, theft and drug trafficking. The data on the determinants of crime are as follows:
- Population aging index: well above average, with a 209,95%.
- Foreigners index: well below average, with a 3,75% of the total population.
- Tourist movements registered at borders: below average, with a total of 294.129 people.
- Social Work Units: in the mean, with a total of 114 UTS (11 For each 100.000 population).
The Balearic Islands have the highest average annual crime rate in Spain; 1638,75 crimes for each 100.000 population. The four quarters of each year are similar, but very different from each other. The first quarter has the lowest crime rate, which rises notably in the second trimester and reaches its maximum peak in the third. The fourth quarter drops notably. Regarding the criminal typologies, has a high rate of murder attempts, fights, kidnappings, penetrative sexual assault, non-penetrative sexual assault, robbery with violence, burglaries, house robberies, thefts, vehicle theft and drug trafficking. On the other hand, has a low murder rate. Also, It is noteworthy that it is the community with the highest number of sexual assaults with and without penetration and thefts, and the third in assassination attempts, fights, vehicle thefts and drug trafficking. Regarding the figures of the determinants of crime, are the following:
- Population aging index: below average, with a 96%.
- Foreigners index: well above average, with a 16,75% of the total population.
- Tourist movements registered at borders: above average, with a total of 13.792.296 people.
- Social Work Units: well below average, with a total of 11 UTS (0,98 For each 100.000 population).
The Canary Islands have an average annual crime rate that is within the national average, with 1087,3 crimes for each 100.000 population. The four quarters of this autonomous community have a similar crime rate, although there is a slight drop in the second quarter. Regarding crime typologies, has a high murder rate, assassination attempts, fights, penetrative sexual assault, non-penetrative sexual assault, thefts, vehicle theft and drug trafficking. On the other hand, has a medium kidnapping rate, robbery with violence, burglary and burglary. Also, It is noteworthy that it is the third autonomous community with the most murders in Spain. The results on the determinants of crime are as follows:
- Population aging index: below average, with a 105,73%.
- Foreigners index: in the mean, with a 11,7% of the total population.
- Tourist movements registered at borders: above average, with a total of 14.214.222 people.
- Social Work Units: below average, with a total of 125 UTS (5,92 For each 100.000 population).
Cantabria has an average crime rate below the annual average for the country, presenting a figure of 763,65 crimes for each 100.000 population. Also, It is one of the communities that has maintained its crime rate more stable since the year 2017 al 2019. Regarding the quarters, there is an increase in crime during the third, while the other three remain at the same level. On the other hand, if the criminal typologies are observed, has a high rate of burglaries in homes, an average murder rate, fights and burglaries. However, a low rate of assassination attempts, kidnappings, penetrative sexual assault, non-penetrative sexual assault, robbery with violence, thefts, vehicle theft and drug trafficking. Also, the fact that it is the second community with the fewest murders and the first with the fewest kidnappings can be highlighted, sexual assault with and without penetration and drug trafficking. Regarding the determinants of crime, the figures are as follows:
- Population aging index: above average, with a 146,34%.
- Foreigners index: below average, with a 5,07% of the total population.
- Tourist movements registered at borders: below average, with a total of 414.489 people.
- Social Work Units: above average, with a total of 119 UTTS (20,5 For each 100.000 population).
Castilla y León has a low annual crime rate, with 771,63 For each 100.000 population, and maintains a stable crime rate during the four quarters of the year. Regarding the criminal typologies, has an average rate of burglaries in homes, and a low murder rate, assassination attempts, fights, kidnappings, penetrative sexual assault, non-penetrative sexual assault, robbery with violence, house robberies, thefts, vehicle theft and drug trafficking. Also, It can be highlighted that it is the third territory with the least sexual assaults without penetration and robberies with violence, and the first with less fights. The figures for the determinants of crime are:
- Population aging index: well above average, with a 190,36%.
- Foreigners index: below average, with a 5,04% of the total population.
- Tourist movements registered at borders: below average, with a total of 1.458.546 people.
- Social Work Units: above average, with a total of 407 UTS (16,77 For each 100.000 population).
Castilla-La Mancha has a low average annual crime rate; 831,64 crimes for each 100.000 population. With regard to criminal typologies, has a high rate of kidnappings, burglaries and burglaries, an average rate of robberies in assassination attempts, vehicle thefts and drug trafficking, and a low murder rate, fights, penetrative sexual assault, non-penetrative sexual assault, robbery with violence and theft. Also, It is noteworthy that it is the third community with the least thefts and the second with the fewest fights. Finally, these are the data on the determinants of crime:
- Population aging index: below average, with a 113,83%.
- Foreigners index: below average, with a 7,9% of the total population.
- Tourist movements registered at borders: below average, with a total of 226.221 people.
- Social Work Units: above average, with a total of 455 UTS (22,39 For each 100.000 population).
Catalonia has a high annual crime rate, reaching the 1513,66 crimes for each 100.000 population. Also, is one of the communities that has experienced the highest increase in crime since the year 2017 al 2019, and its quarters show variations throughout the year. Crime increases slightly from first to second trimester, increases again in the third quarter and decreases in the fourth. Regarding crime typologies, has a high murder rate, assassination attempts, penetrative sexual assault, non-penetrative sexual assault, robbery with violence, burglaries, house robberies, thefts, vehicle theft and drug trafficking. On the other hand, has a medium rate of fights and kidnappings. Also, It is noteworthy that it is the first community with the most penetrative sexual assaults, robbery with violence, burglaries and thefts, as well as the third with the most house robberies. The data on the determinants of crime are as follows:
- Population aging index: below average, with a 111,87%.
- Foreigners index: above average, with a 13,7% of the total population.
- Tourist movements registered at borders: above average, with a total of 19.118.421 people.
- Social Work Units: below average, with a total of 631 UTS (8,35 For each 100.000 population).
The Valencian Community has a high annual crime average, with a figure of 1159,67 crimes for each 100.000 population. Has a crime rate that increases in the third quarter, but the other three stay at the same level. Regarding criminal typologies, has a high murder rate, assassination attempts, penetrative sexual assault, non-penetrative sexual assault, robbery with violence, burglaries, house robberies, thefts, vehicle theft and drug trafficking. On the other hand, has a medium rate of fights and kidnappings. Also, It can be noted that it is the second community with the most house robberies and the third with the most house robberies.. Finally, the results of the determinants of crime are as follows:
- Population aging index: in the mean, with a 118,05%.
- Foreigners index: above average, with a 12,9% of the total population.
- Tourist movements registered at borders: above average, with a total of 8.925.959 people.
- Social Work Units: below average, with a total of 327 UTS (6,61 For each 100.000 population).
Extremadura has the lowest annual crime rate in Spain; 625,77 crimes for each 100.000 population. To this we must add that it is one of the communities that has maintained the crime rate more stable since 2017 a 2018, which also remains stable during the four quarters of the year. Regarding criminal typologies, has a medium rate of murder and drug trafficking, and a high rate of assassination attempts, fights, kidnappings, penetrative sexual assault, non-penetrative sexual assault, robbery with violence, burglaries, house robberies, theft and theft of vehicles. Also, It can be highlighted that it is the first community with the least robberies with violence, thefts and thefts of vehicles, the second with fewer sexual assaults and the third with fewer fights. The data on the determinants of crime are as follows:
- Population aging index: above average, with a 134,81%.
- Foreigners index: below average, with a 2,92% of the total population.
- Tourist movements registered at borders: below average, with a total of 380.914 people.
- Social Work Units: below average, with a total of 76 UTS (7,03 For each 100.000 population).
Galicia has a low annual crime rate, presenting the figure of 716,56 crimes for each 100.000 population. The crime rate of this community does not experience relevant variations during the quarters of the year, except for a slight elevation in the third trimester. Regarding the criminal typologies, has a low index in all; murders, assassination attempts, fights, kidnappings, penetrative sexual assault, non-penetrative sexual assault, robbery with violence, burglaries, house robberies, thefts, vehicle theft and drug trafficking. Also, It is noteworthy that it is the third community with the fewest assassination attempts, vehicle thefts and drug trafficking. The figures for the determinants of crime are as follows:
- Population aging index: 192,51%, well above average.
- Foreigners index: well below average, with a 3,21% of the total population.
- Tourist movements registered at borders: below average, with a total of 1.291.086 people.
- Social Work Units: above average, with a total of 417 UTS (15,39 For each 100.000 population).
The Community of Madrid has an annual average of high crime, reaching the 1493,28 crimes for each 100.000 population. Also, the capital of the country has a notorious variation in the crime rate in each quarter of the year. The first two quarters remain very similar, the third quarter decreases and the fourth quarter increases, reaching its maximum peak. With regard to criminal typologies, has a high rate of kidnappings, penetrative sexual assault, robbery with violence, burglaries, house robberies, thefts, vehicle theft and drug trafficking. On the other hand, has a medium murder rate and non-penetrative sexual assault, and a low rate of attempted murders and fights. It can be highlighted that it is the second community with the most vehicle thefts and the third with the most robberies with violence and thefts. Regarding criminality factors, the figures are as follows:
- Population aging index: below average, with a 103,76%.
- Foreigners index: above average, with a 12,22% of the total population.
- Tourist movements registered at borders: above average, with a total of 6.699.785 people.
- Social Work Units: below average, with a total of 101 UTS (being 1,55 For each 100.000 population).
The Region of Murcia has an annual average that is within the country's average; 926,6 crimes for each 100.000 population. Also, maintains similar crime levels in all its quarters. Regarding crime typologies, has a high murder rate, assassination attempts, kidnappings, penetrative sexual assault, non-penetrative sexual assault, robbery with violence, burglaries, burglaries and vehicle theft. On the other hand, has a medium rate of fights and thefts, and one low from drug trafficking. Also, It is noteworthy the fact that it is the community with the highest number of robberies in homes and robberies in houses. Regarding the determinants of crime, presents the following figures:
- Population aging index: below average, with a 83,38%.
- Foreigners index: above average, with a 12,48% of the total population.
- Tourist movements registered at borders: below average, with a total of 91.209 people.
- Social Work Units: in the mean, with a total of 145 UTS (9,86 For each 100.000 population).
The Autonomous Community of Navarra has an annual crime rate within the national average, presenting 1044,45 crimes for each 100.000 population. On the other hand, This community is one of those that has increased its crime rate the most since 2017 a 2019. Regarding the quarterly variation, crime spike occurs in the third quarter, while the rest remain at similar levels. On the other hand, presents the following indices in criminal typologies; high murder rate, assassination attempts, fights, kidnappings, penetrative sexual assault, non-penetrative sexual assault and theft; Average home burglary rate, burglaries and drug trafficking; a low rate of robbery and car theft. Also, It can be highlighted that it is the second territory in the country with the most murders and the third with the most sexual assaults with and without penetration.. Then, these are the results on the determinants of crime:
- Population aging index: in the mean, with a 116,49%.
- Foreigners index: above average, with a 8,49% of the total population.
- Tourist movements registered at borders: below average, with a total of 333.317 people.
- Social Work Units: They do not appear in the database due to the special economic regime of the Community of Navarra.
The Basque Country has an annual average within the Spanish average; 1016,33 crimes for each 100.000 population. Regarding crime during the quarters of the year, the first quarter remains at the same level as the second, in the third it increases a little, and the third and the fourth stay the same again. Regarding the criminal typologies, has a high rate of fights, kidnappings, penetrative sexual assault, robbery with violence, burglaries, burglaries and thefts. On the other hand, has a medium rate of attempted murder and carjacking, and a low murder rate, non-penetrative sexual assault and drug trafficking. Also, It can be highlighted that it is the second community with the most kidnappings in the country, but the third with the least murders. By last, the data on the determinants of crime are as follows:
- Population aging index: above average, with a 144,99%.
- Foreigners index: in the mean, with a 6,51% of the total population.
- Tourist movements registered at borders: below average, with a total of 1.514.765 people.
- Social Work Units: They do not appear in the database due to the special economic regime of the Basque Country.
La Rioja has a low annual crime rate, presenting the figure of 650,01 crimes for each 100.000 population. This is one of the communities whose crime rate has increased the most since 2017 a 2019. However, crime remains stable during the four quarters of the year. Regarding the typology of crimes, a high rate of drug trafficking is observed, an average rate of assassination attempts, fights, penetrative sexual assault and home burglary, and a low murder rate, kidnappings, non-penetrative sexual assault, robbery with violence, burglaries, theft and theft of vehicles. It can be noted that this community is the second with the least kidnappings and robberies with violence, and the first with fewer murders. The figures on the determinants of crime are as follows:
- Population aging index: in the mean, with a 130,9%.
- Foreigners index: above average, with a 11,11% of the total population.
- Tourist movements registered at borders: below average, with a total of 124.189 people.
- Social Work Units: well above average, with a total of 95 UTS (30,12 For each 100.000 population).
The Autonomous City of Ceuta has a high annual crime rate, with 1366,84 crimes for each 100.000 population. This is one of the areas with the greatest disparity in crime between all quarters of 2017, 2018 and 2019. Regarding the criminal typology, has a high murder rate, assassination attempts, fights, kidnappings, penetrative sexual assault, non-penetrative sexual assault, robbery with violence, vehicle theft and drug trafficking. On the other hand, There is a medium rate of thefts and a low rate of burglaries in houses and burglaries. Also, It is interesting to note that it is the first territory in the country with the most murders, assassination attempts, kidnappings, vehicle thefts and drug trafficking, and the second with the highest number of fights and sexual assaults without penetration. However, It is the first area with fewer burglaries in houses and burglaries in houses. The data on the determinants of crime are as follows:
- Population aging index: below average, with a 51,35%.
- Foreigners index: below average, with a 6,64% of the total population.
- Tourist movements registered at borders: It does not appear in the INE database.
- Social Work Units: well below average, with a total of 1 UTS (1,17 For each 100.000 population).
The Autonomous City of Melilla has the second highest annual crime rate in the country; 1523,8 crimes for each 100.000 population. This is one of the territories with the highest increase in crime since 2017 until 219, as well as one of the areas with the highest variability of crimes between quarters and between years of 2017 a 2019. Regarding the criminal typologies, has a high rate of attempted murder, fights, non-penetrative sexual assault, robbery with violence, thefts, vehicle theft and drug trafficking. On the other hand, has a medium rate of penetrative sexual assault, and one low of murders, kidnappings, burglaries and burglaries. Also, It is noteworthy that it is the first area of the country with more fights and robberies with violence, and the second with more assassination attempts and drug trafficking. However, it is the second with the least murders and robberies in dwellings, and the third with fewer kidnappings and house robberies. The determinants of crime present the following figures:
- Population aging index: well below average, with a 40,02%.
- Foreigners index: well above average, with a 15,5% of the total population.
- Tourist movements registered at borders: It does not appear in the INE database.
- Social Work Units: well below average, with a total of 3 UTS (3,48 For each 100.000 population).
This study has managed to determine the crime rate of each autonomous community (alto, medium or low), which is shown below ordered by areas from highest to lowest crime. First, the territories that can be described as the hottest crime hotspots in Spain, son: Balearic Islands, Autonomous City of Melilla, Catalonia, Madrid's community, Autonomous City of Ceuta and Valencian Community. Then, the territories whose crime rate is within the average are: Canary Islands, Foral Community of Navarra, Basque Country, Andalusia and Region of Murcia. Finally, the communities with the lowest crime rate, so they can be called crime cold spots or "coldspots", son: Castilla la Mancha, Aragon, Castile and Leon, Cantabria, Galicia, The Rioja, Principality of Asturias and Extremadura.
Likewise, the behavior of criminal activity has been observed in the timeline. A general increase in crime can be seen since the year 2017 al 2019 in all the country. However, This has been more noticeable in the Autonomous City of Melilla, Catalonia, Foral Community of Navarra, La Rioja and Aragon. On the contrary, the areas whose crime has been more stable are Andalusia, Valencian Community, Cantabria, Extremadura and Principality of Asturias.
Continuing in this sense, the four quarters of 2017, 2018 and 2019. Thus, It has been found that there are autonomous communities that present guidelines on the amount of crimes that are committed in each quarter and that are repeated during the three years. These patterns are as follows:
- Communities whose crime rate is very stable during all quarters of the year, as the Principality of Asturias, Castilla Leon, Castilla la Mancha, Estremadura, Region of Murcia and La Rioja.
- Communities with a stable crime rate, although with a slight elevation of the third and fourth trimesters, like the Basque Country.
- Communities whose crime is stable and have a slight increase in crime only in the third quarter, like Andalusia and Galicia.
- Communities with a Notorious Increase in Crime During the Third Quarter, as Balearic Islands, Cantabria, Catalonia, Valencian Community and Foral Community of Navarra.
- Communities where crime declines in the third quarter, as Community of Madrid and Aragon.
- Communities where crime declines in the second quarter, as Canarias.
- Communities that do not follow a clear pattern because they have a lot of variation between quarters, such as the Autonomous Cities of Ceuta and Melilla and, to a lesser extent, Aragon.
Watching this, It has been possible to determine that the territories of the country that have a high crime rate also have a more noticeable variation in crime between quarters, as Balearic Islands, Autonomous City of Ceuta, Autonomous City of Melilla, Catalonia, Valencian Community, Community of Madrid and Foral Community of Navarra (highlighting the first three mentioned). On the contrary, areas with less crime are more stable throughout the year: Principality of Asturias, Castile and Leon, Castilla la Mancha, Estremadura, Galicia and La Rioja.
Then, and with regard to the analysis of criminal typologies, the following has been appreciated; the autonomous communities that have the highest rate of committing some type of crime have a medium or high general crime rate. Also, They do not usually stand out for being the area with the least commission of another type of crime (for example, if the Region of Murcia is the community with the most robberies in houses and dwellings, it will not be the community with the least fights). In the same way, the communities that have the lowest rate of committing a type of crime, have a low overall crime rate. Also, They also do not usually stand out for being the area with the highest commission of other criminal types. However, the only three areas of Spain that do not comply with this are the Autonomous City of Ceuta, the Autonomous City of Melilla and, to a lesser extent, the Basque country.
In this way, It can be said that the Autonomous City of Ceuta and Melilla are very inconsistent and disparate territories in terms of the information they provide on crime. However, It is not surprising that they have a behavior that differs from the rest of the communities in Spain, because its peculiarities are quite known (both geographical and social and economic). Thus, and due to the administrative need to incorporate these territories into a regional list, notable differences can be observed in the statistics with respect to the rest of the country's regions (Córdoba & Garcia, 1992).
Concluding with regard to the results on crime rates, it is appreciated that the highest, and some of the media, They occur in the warmest areas of the country bathed by the Mediterranean Sea. While, the northern and inland areas of Spain are those with the lowest rates. This phenomenon coincides with the postulates of Quetelet's thermal laws; more conflicts and fights occur in places with hot climates due to the increase in the consumption of beverages (highlighting the alcoholic), socialization and irritability of people, among others (Quetelet, 1848 cited by Orellana, 2007). Also, along with this increase in crime, an increase in four other factors has also been found to have a correlation with crime (either direct or reverse); The tourism, immigration, the aging of the population and Social Work Units.
First, it is common for there to be more tourism in coastal areas and with warm climates. These zones are often associated with a vacation period and disconnection from routine.. In the case of this study, the territories with tourism above the average are Andalusia, Balearic Islands, Canary Islands, Catalonia and the Valencian Community. The only exception is the Community of Madrid which, being the capital of the country, it also receives a number of tourists above the national average (although to a lesser extent). Thus, this could be related to crime in two ways; that the tourist becomes the victim of crime; that the tourist becomes the criminal. If it turns out to be the victim, This could be explained by the fact that they usually carry money and valuables, as well as adopting a more passive and careless attitude (Maxfield, 1987). On the other hand, the tourist could also be the perpetrator of the crime because he is not in his usual environment and can change his behavior to a more uninhibited and irresponsible one, especially if it is in alcohol or drug environments (Sharpley, 1994).
Secondly, a relationship between crime and immigration has also been identified, in the sense that almost in the 50% of areas where there are more foreigners, there is also more crime. The autonomous communities with immigration above the average are Aragon, Balearic Islands, Canary Islands, Catalonia, Valencian Community, Madrid's community, Murcia region, La Rioja and the Autonomous City of Ceuta. However, and in view of the results of empirical studies that go much deeper into this matter, it cannot be concluded that immigration increases the crime of a place by itself. In fact, the works of both Alonso-Borrego et al. (2012) as from Garcia Spain (2019) they indicate the opposite; if other elements such as education and gender are taken into account, it is shown that foreigners contribute to preventing a country's crime rate from increasing. Of course, This does not mean that there are no groups of immigrants that participate in criminal activity., or that such statements can be applied to all territories. It is always necessary to observe the characteristics of each specific case to see the variations in the results.
Thus, and following the line of these studies, It can be said that the highest immigration rates coincide with the highest crime rates in the same territory. However, they wouldn't explain each other. Although at first it does not seem to be related to the topic of discussion, according to Gould et al. (2002) tourism activity generates greater job opportunities and higher wages than in other sectors. Taking this statement into account, the following arises; people who leave their country of origin tend to do so seeking a better quality of life, what the search for the best possible job and salary implies. So that, the areas with the greatest development of the tourism sector become attractive destinations, for both criminal activity and immigration. It's more, These hot parts of the country are not just hotbeds of crime, tourist activity and foreigners. It has also been identified a higher rate of young population than older, which leads to the next point to comment; the inverse relationship between population aging and crime.
The results of the correlation analysis carried out in this work show that when an autonomous community has a higher rate of aging, has a lower crime rate. In this way, the autonomous communities with aging above the average are Aragon, Principality of Asturias, Cantabria, Castile and Leon, Estremadura, Galicia, Basque Country and La Rioja. Based on data from the INE, it can be said that older people commit fewer crimes than younger ones; he 66,94% of adults convicted in 2017 has between 18 and 40 year old, he 20,34% is made up of people between 41 and 50 years and, from there, the figure drops drastically. Also, along with this, juvenile delinquency should be taken into account.
Finally, The last factor that has been found to have a significant relationship with regard to crime is the Social Work Units (UTS); how many fewer UTS in an autonomous community, higher crime rate. The country's territories with a higher amount of UTS for each 100.000 inhabitants are Cantabria, Castile and Leon, Castilla la Mancha, Galicia and La Rioja. As already mentioned, the main function of these is to assist citizens in their access to Social Services, thus constituting the most basic level of the structure. They are part of the entities with social initiative that, as Pastor says (2001), They carry out a work of social and labor integration and care for citizens without a family nucleus or coexistence (among many others). It is important to note that a maladjustment to social or work life, as well as an absence or destructuring of the family nucleus, are one of the risk factors that can cause criminal behavior (Thérond, Hearing & Capron, 2002). Thus, if there is no entity that contributes to this not happening, or these are very scarce, Chances of Increase in Area Crime Rates Increase.
Regarding the educational level of the population as a determining factor of crime, a certain level of relationship has been found in the correlation study, but it is not taken into account because it is very weak. However, and according to the work of Ruiz-Morales (2018), the possibility is raised that perhaps the determining factor is not the level of education of the population, but the quality of education itself. The results obtained did not show a relevant relationship between crime and educational level, but yes between crime and the quality of education[30] of each autonomous community.
Definitely, This study has made it possible to identify which are the territories of the country with the highest and lowest concentration of crime, observe how criminal activity behaves over time (and even identify a series of patterns) and determine the indices (tall, medium or low) of each criminal typology in the autonomous communities. Likewise, crime has been related to four of the twelve factors originally selected; tourism, immigration, aging of the population and Social Work Units. However, It is also necessary to take into account the factors that have not been determining, in order to learn from them and take them into account or not in future studies; PIB per cápita, average annual income per household, at-risk-of-poverty rate, unemployment rate, education level, early dropout from education, public spending on education and public spending on culture.
From now on, the field of criminology that is dedicated to the study of crime in the different territories presents a wide range of possibilities. As input for possible future research, and as a result of the results obtained, four aspects are worth highlighting; the importance of considering demographics, social and economic when seeking to establish a relationship between crime and immigration; the need to delve into different characteristics of education (as the quality of it) to see if it really affects crime; exploring the broad domains of social work to see how it affects crime; and the possibility of studying whether the participation of citizens in cultural activities reduces the commission of criminal types. Continuing to carry out this type of study is essential to get an approximation to the criminal reality of a country, region, city or neighborhood, especially if they can be supported by a map or a Geographic Information System (SIG). As Reyes Echandía says (1999):
Criminology as a study of crime in all its aspects, requires field research to identify the complex etiology of crime and its dynamics; such investigations, at the same time, require the help of statistics, because only through it is it possible to quantify the data provided, establish correlations between them, analyze them, draw conclusions and make criminal prophylaxis recommendations that seem appropriate.
The initial objective of the project was to develop a crime map in the city of Valencia. This required the collection of anonymous crimes committed in the city during a specified period of time and disaggregated by the different streets or districts.. Thus, a search of the data began in different government entities; Ministry of Interior, Valencia City Council, National Police Corps and Local Police Corps. However, none of them could provide the information because, or they did not have it, or they couldn't by law.
Thus, the object of study was redirected to crime in the autonomous communities of Spain, and the process carried out was as follows:
- Search and extraction of data in the statistics of the Ministry of the Interior. Data related to total crimes and types of crime in the autonomous communities during the years 2017, 2018 and 2019.
- Review of the empirical literature on the subject.
- Division of the study structure into three analysis sections; one relating to total crimes; one on the types of crime; and one related to the determinants of crime.
- Preparation of the theoretical framework with the most relevant bibliography for the study.
- Ordering and classification of data in tables according to the interest of the study.
- Data analysis using the Excel program and graphing.
- Information supplementation with the virtual map.
- Description of the graphs and the results obtained.
- Search and extraction of data in the statistics of the Ministry of the Interior and the National Institute of Statistics (OTHER). Data on the determinants of crime in 2017.
- Correlation study through Excel program. Preparation of tables and graphs.
- Description of the graphs and the results obtained.
- Synthesis and sharing of the most significant results obtained.
- Final conclusions comparing the results with other studies on the subject.
Alonso-Borrego, C.; Grouper N. & Vazquez P. (2012). “Does Immigration Cause Crime? Evidence from Spain” American Law and Economics Review 14 (1), pp. 165-191. Doi: 10.1093/aler / ahr019
Araya Moya, J. and Sierra Cisternas, D. (2002). "Influence of social risk factors in the origin of criminal behavior. Social-criminal vulnerability index. " Study series, Citizen Security Division, Ministry of Interior, Government of Chile, pp. 82.
Barreto, M. (2002). "School dropout and criminality". Citizen Security Division, Ministry of Interior, Government of Chile. Analysis Series. Nº1.
Chaney, S.; Tompson, L. & Uhlig S.. (2008). “The utility of hotspot mapping for predicting spatial patterns of crime”, Security Journal (21), pp. 4-28.
Cordoba Ordonez, J., & Garcia Alvarado, J. M. (1992). Contribution to the Social Geography of Spain: regional differences in wage employment. Annals of Geography of the Complutense University, 12, 215. Retrieved from https://revistas.ucm.es/index.php/AGUC/article/view/AGUC9292110215A
Corman H. & Mocan, N. (2000). “A time-series analysis of crime, deterrence, and drug abuse in New York city”. American Economic Review. Vol. 90, nº3, pp. 584-604
Corman, H. & Mocan, N. (2005). “Carrots, Sticks and Broken Windows”. Journal of Law and Economics. Vol 48, pp. 235-266
Fernandez Molina, E.; Bartolomé Gutiérrez, R.; Alberola stove, C., and Megías Boró, A. (2009). "Evolution and trends of juvenile delinquency in Spain". Spanish Journal of Criminological Research (7), pp. 1-30. Recovered from https://reic.criminologia.net/index.php/journal/article/view/42
Fernandez Molina, E.; Vazquez, D and Belmonte, M. (2013). Crime hot spots. An analysis of the spatial distribution of the criminal phenomenon in the city of Albacete. IV Iberian Conference on Spatial Data Infrastructure, 351-363.
Ferreira, B. R. (1998). "Relations between school, school performance and delinquency ". International Journal of comparative and applied criminal justice, vol 22 Extract and Translation of Citizen Peace Foundation, Concepts, for the prevention and containment of crime. nº21, Feb 1999.
Garcia Spain, E. (2019). "More immigration, less crime " Criminal Criticism and Power: publication of the Observatory of the Penal System and Human Rights (18), pp. 194-205. ISSN-e 2014-3753.
Garcia, R., (1994). "Participation in illegal activities: Empirical evidence of theft for the Chilean case: Final Report Title Seminar ". Pontifical Catholic University of Chile, Institute of economics. Second half.
Garrido, V.; Stangeland, P. and Redondo S. (1999). "Principles of Criminology" Valencia, Tirant lo Blanch.
Gould, E.; Mustard, D. & Weinberg, B. (2002). “Crime rates and local labor market opportunities in the United States: 1977-1997.” Rev Econ Stat, pp. 45-61.
Guerry, A. M. (1833). “Essay on the moral statistics of France”. Paris: Crochard.
Hernando Sanz, F. (2001). "Space and crime". Madrid, Economic and Social Council of the Community of Madrid, 423 pp.
Cars, S. & Meghir, C. (2000). “Crime and economic incentives”. Journal of Human Resources. Vol.39, nº4, pp. 958-979
Maxfield, M.G. (1987) “Household composition, routine activity and victimisation: A comparative analysis.” Journal of Quantitative Criminology, pp. 301-320.
Mears, D. (2001). “The Immigration-Crime nexus: Toward an analytic framework for assessing and guiding Theory, Research and Policy.” Sociological Perspectives, 44 (1).
Montolio, D., and Planells Struse, S. (2012). "Does tourism stimulate criminal activity? Evidence for the Spanish provinces. " Spanish Journal of Criminological Research.
Ocáriz, E.; Vozmediano, L. and Germán, I. (2011). “The variable place of residence of the juvenile offenders: Relevance and proposals for its geographic analysis”, International e-Journal of Criminal Science, 5(1).
Orellana Wiarco, THE. A. (2007). Criminology Handbook (11ª ed.). Mexico: Editorial Porrúa.
Orellana Wiarco, THE. A. (2016). "Manual of Criminology". Mexico: Editorial Porrúa.
Pastor Seller, E. (2001). "Social initiative and community social work". Alternatives. Social Work Notebooks. (9), pp. 169-191 ISSN 1133-0473. Doi:
10.14198/ALTERN2001.9.9
Pizam, A. (1982). “Tourism and crime: Is there a relationship”. Journal of Travel Research, 20 (7).
Quetelet, A (1848). “Of the social system and the laws which govern it”. Paris: Guillaumin.
Quetelet, A. (1842). “A Treatise on Man and the Development of His Faculties: A Facsim.”. History of psychology series, Scholars’ Facsimiles & Reprints.
Quiroz, C. A. and Quiroz, C. R. (1970). The social cost of crime in Mexico: Symposium on the cost of crime and social defense against it. Mexico: Boots Library and Editions.
Raphael, S. & Winter-Ember, R. (2001). “Identifying the effect of unemployment on crime”. Journal of Law and Economics. Vol XLIV, pp. 259-283.
Reyes Echandía, A. (1999). Criminology (8ª ed.). Colombia: Temis
Rodriguez Andres, A. (2003). "The Socio-economic Determinants of Crime in Spain". Spanish Journal of Criminological Research (1): REIC, ISSN 1696-9219, N. 1.
Rodriguez Manzanera, L. (1979) "Criminology", Mexico: Editorial Porrúa.
Ruiz-Morales, M. (2018). "Determining factors of crime in Spain. Study of statistical correlation ". Via Iuris Magazine, pp. 1-41. Doi: 10.37511/viaiuris.n25a3.
Sanchez Delgado, H. (2017). "Ecological analysis of crime in the city of Barcelona". Autonomous University of Barcelona. Faculty of Law.
Sharpley, R. (1994). “Tourism, tourists and society” Huntingdon: Elm.
Thérond, C., Hearing, M. & Capron, C. (2002). Socioeconomical status (HIS) and children behaviour disorders. VIII Conference of the European Association for Research on Adolescence, earas. Oxford
Varona Martinez, G. (2012). “Spatial analysis of georeferential data of criminological interest in the C.A. of Euskadi ”. Basque Institute of Criminology, Donostia (Spain).
Middle Voice L. and San Juan C. (2010). "Environmental Criminology. Ecology of Crime and Security ". Barcelona: UOC Editorial
Williams Reid, L.; Weiss, H.; Adelman, R. y Jaret, C. (2005). “The immigration-crime relationship: Evidence across US metropolitan areas.” Social Science Research, 34 (4).
Annexes relating to the official sources of the data used:
- Ministry of Interior, total crimes and by quarters:
https://estadisticasdecriminalidad.ses.mir.es/publico/portalestadistico/
- Statistics National Institute, population aging index:
https://www.ine.es/dynt3/inebase/index.htm?padre=2077&capsel=2077
- Statistics National Institute, foreign population 2017:
https://www.ine.es/jaxi/Tabla.htm?path=/t20/e245/p08/l0/&file=02005.px&L=0
- Ministry of Interior , educational level of people 25-64 years in 2017: http://estadisticas.mecd.gob.es/EducaDynPx/educabase/index.htm?type=pcaxis&path=/Formacionyml/EPA_2020_05/NivFor&file=pcaxis&l=s0
- Ministry of Interior, percentage distribution of the population of 18-24 years with early educational dropout (secondary is not completed) 2017: http://estadisticas.mecd.gob.es/EducaDynPx/educabase/index.htm?type=pcaxis&path=/Formacionyml/EPA_2020_05/Aban&file=pcaxis&l=s0
- Ministry of Interior, employment and unemployment rate of the population of 25-64 years by autonomous community 2017: http://estadisticas.mecd.gob.es/EducaDynPx/educabase/index.htm?type=pcaxis&path=/Formacionyml/EPA_2020_05/Form&file=pcaxis&l=s0
- Statistics National Institute, average annual income per household 2017:
- Statistics National Institute, risk of poverty rate 2017:
- Ministry of Interior, Social Work Units 2017, (P. 66):
https://www.mscbs.gob.es/ssi/familiasInfancia/ServiciosSociales/docs/MemoriaPC_2017_18.pdf
- Statistics National Institute, PIB per cápita 2017:
- Ministry of Interior, total public spending on education by Administration 2017: http://estadisticas.mecd.gob.es/EducaDynPx/educabase/index.htm?type=pcaxis&path=/Recursosecon/Gasto/2017&file=pcaxis&l=s0
- Ministry of Interior, expenditure on culture by the Autonomous Administration by autonomous community, destination of expenditure and economic nature of expenditure 2017: http://estadisticas.mecd.gob.es/CulturaDynPx/culturabase/index.htm?type=pcaxis&path=/t3/p3/a2005/&file=pcaxis
- Statistics National Institute, tourist movements at borders 2017: https://www.ine.es/dynt3/inebase/index.htm?padre=3616&capsel=3616
- Statistics National Institute, convicted according to age 2017 (is mentioned in the conclusions of the section):
https://www.ine.es/jaxiT3/Datos.htm?t=26013#!tabs-tabla
Annexes relating to the tables of the data used:
Table 1, graphic 1 and 2: Average of crimes for each 100.000 population
| Average of crimes for each 100 000 population | ||||
| 2017 | 2018 | 2019 | Total | |
| Andalusia | 997,42 | 993,5 | 1010,05 | 1000,33 |
| Aragon | 723,55 | 768,97 | 830,5 | 774,34 |
| Principality of Asturias | 619,63 | 643,15 | 666,28 | 643,02 |
| Balearic Islands | 1616,42 | 1615,366 | 1684,48 | 1638,75 |
| Canary Islands | 1083,417 | 1064,13 | 1114,35 | 1087,3 |
| Cantabria | 751,341 | 760,69 | 778,94 | 763,65 |
| Castile and Leon | 740,72 | 775,621 | 798,54 | 771,63 |
| Casilla-La Mancha | 787,67 | 840,17 | 867,08 | 831,64 |
| Catalonia | 1397,21 | 1550,6 | 1593,16 | 1513,66 |
| Valencian Community | 1148,95 | 1166,37 | 1163,69 | 1159,67 |
| Estremadura | 611,41 | 618,32 | 647,6 | 625,77 |
| Galicia | 684,68 | 721,46 | 743,54 | 716,56 |
| Madrid's community | 1464,69 | 1482,024 | 1533,12 | 1493,28 |
| Murcia region | 895,92 | 928,18 | 955,7 | 926,6 |
| C. Foral of Navarra | 964,96 | 1053,46 | 1114,92 | 1044,45 |
| Basque Country | 953,52 | 1025,58 | 1069,9 | 1016,33 |
| The Rioja | 624,4 | 634,35 | 691,29 | 650,01 |
| C. A. of Ceuta | 1325,05 | 1372,08 | 1403,38 | 1366,84 |
| C. A. from Melilla | 1377,14 | 1581,6 | 1612,67 | 1523,8 |
Table 2, graphic 3: Crimes for each 100.000 inhabitants and by quarters of 2017
| Crimes for each 100.000 population 2017 | ||||
| t1 | t2 | t3 | t4 | |
| Andalusia | 993,183624 | 1007,84981 | 1028,11278 | 960,569559 |
| Aragon | 725,348615 | 721,986628 | 696,007641 | 750,86915 |
| Principality of Asturias | 616,835433 | 605,14416 | 637,319317 | 619,250986 |
| Balearic Islands | 1090,9508 | 1637,90469 | 2314,07017 | 1422,76113 |
| Canary Islands | 1177,77869 | 1027,45526 | 1060,80249 | 1067,63321 |
| Cantabria | 709,122084 | 741,174747 | 838,366693 | 716,704435 |
| Castile and Leon | 728,666531 | 730,810153 | 747,175881 | 756,245051 |
| Casilla-La Mancha | 792,870613 | 785,732956 | 778,053822 | 794,052018 |
| Catalonia | 1283,80337 | 1363,79458 | 1464,68356 | 1476,59489 |
| Valencian Community | 1119,39491 | 1117,65455 | 1240,87602 | 1117,87715 |
| Estremadura | 626,250093 | 600,229647 | 600,414846 | 618,749537 |
| Galicia | 646,374032 | 678,533965 | 723,506179 | 690,312402 |
| Madrid's community | 1499,81928 | 1456,17521 | 1369,73228 | 1533,05946 |
| Murcia region | 898,948699 | 854,467164 | 920,305277 | 909,967061 |
| C. Foral of Navarra | 899,828056 | 914,597176 | 1108,15038 | 937,294981 |
| Basque Country | 927,645138 | 914,382647 | 977,641537 | 994,413347 |
| The Rioja | 632,885304 | 594,51901 | 648,739144 | 621,470539 |
| C. A. of Ceuta | 1514,84834 | 1239,42137 | 1325,34517 | 1220,58875 |
| C. A. from Melilla | 1357,40827 | 1251,74176 | 1473,52531 | 1425,91732 |
Table 3, graphic 4: Crimes for each 100.000 inhabitants and by quarters of 2018
| Crimes for each 100.000 population 2018 | ||||
| t1 | t2 | t3 | t4 | |
| Andalusia | 934,794681 | 1006,24874 | 1047,1103 | 985,877596 |
| Aragon | 682,341938 | 711,530585 | 789,468858 | 892,546045 |
| Principality of Asturias | 591,007582 | 612,111522 | 675,03433 | 694,484967 |
| Balearic Islands | 1135,25637 | 1604,20513 | 2168,73297 | 1553,27095 |
| Canary Islands | 1105,66179 | 973,076372 | 1066,84025 | 1110,97272 |
| Cantabria | 694,208666 | 736,433374 | 839,49613 | 772,62598 |
| Castile and Leon | 716,472602 | 751,256452 | 816,216746 | 818,541204 |
| Casilla-La Mancha | 798,596018 | 832,39302 | 850,105609 | 879,610145 |
| Catalonia | 1437,9877 | 1529,19745 | 1653,34112 | 1581,90752 |
| Valencian Community | 1105,74706 | 1111,26713 | 1309,86886 | 1138,60559 |
| Estremadura | 593,552019 | 610,609183 | 615,735653 | 653,391906 |
| Galicia | 648,137147 | 706,358821 | 782,753948 | 748,62783 |
| Madrid's community | 1486,437 | 1470,96136 | 1352,52252 | 1618,17759 |
| Murcia region | 890,085891 | 904,086482 | 950,349305 | 968,205131 |
| C. Foral of Navarra | 937,064708 | 939,998826 | 1280,51097 | 1056,28256 |
| Basque Country | 967,810292 | 979,178641 | 1067,30608 | 1088,04195 |
| The Rioja | 606,003009 | 596,499564 | 663,340461 | 671,57678 |
| C. A. of Ceuta | 1269,61383 | 1294,27793 | 1515,08033 | 1409,37706 |
| C. A. from Melilla | 1343,99889 | 1506,06594 | 1678,55158 | 1797,78663 |
Table 4, graphic 5: Crimes for each 100.000 inhabitants and by quarters of 2019
| Crimes for each 100.000 population 2019 | ||||
| t1 | t2 | t3 | t4 | |
| Andalusia | 968,12071 | 1001,10052 | 1070,41159 | 1000,58948 |
| Aragon | 788,681193 | 885,399809 | 793,835477 | 854,095116 |
| Principality of Asturias | 641,767697 | 657,60657 | 697,692609 | 668,068048 |
| Balearic Islands | 1268,42169 | 1768,91758 | 2180,15416 | 1520,45308 |
| Canary Islands | 1118,46954 | 1071,00946 | 1143,0819 | 1124,87804 |
| Cantabria | 736,906233 | 746,543493 | 879,055824 | 753,255157 |
| Castile and Leon | 755,809011 | 772,770538 | 838,616273 | 826,989083 |
| Casilla-La Mancha | 835,619518 | 851,606822 | 906,160425 | 874,972883 |
| Catalonia | 1517,247 | 1567,62994 | 1688,04348 | 1599,7463 |
| Valencian Community | 1117,19786 | 1121,19484 | 1283,2327 | 1133,16582 |
| Estremadura | 636,502421 | 611,870264 | 654,672149 | 687,358927 |
| Galicia | 714,058423 | 733,06195 | 788,961211 | 738,099922 |
| Madrid's community | 1549,79579 | 1514,90367 | 1441,12745 | 1626,66353 |
| Murcia region | 956,624883 | 937,011764 | 974,430651 | 954,750592 |
| C. Foral of Navarra | 962,376226 | 1054,39505 | 1367,44246 | 1075,48906 |
| Basque Country | 1039,86999 | 1030,31286 | 1112,88464 | 1096,53334 |
| The Rioja | 671,090095 | 684,663413 | 718,754538 | 690,660926 |
| C. A. of Ceuta | 1336,44739 | 1230,28652 | 1597,1313 | 1449,68565 |
| C. A. from Melilla | 1532,02215 | 1592,1468 | 1788,70813 | 1537,80337 |
Table 5, graphic 6: Murders for every 100.000 population
| KILLS FOR EVERY 100.000 POPULATION | ||||
| 2017 | 2018 | 2019 | Total mean | |
| Andalusia | 0,58474 | 0,85874 | 0,97454 | 0,80600667 |
| Aragon | 0,61127 | 0,68769 | 0,45479 | 0,58458333 |
| Principality of Asturias | 0,48311 | 0,68077 | 0,6844 | 0,61609333 |
| Balearic Islands | 0,35842 | 0,70865 | 0,52198 | 0,52968333 |
| Canary Islands | 0,94871 | 1,12799 | 0,92877 | 1,00182333 |
| Cantabria | 0,51698 | 0,34469 | 1,03256 | 0,63141 |
| Castile and Leon | 0,53591 | 0,45659 | 0,3334 | 0,44196667 |
| Castilla la Mancha | 0,5907 | 0,39471 | 0,54111 | 0,50884 |
| Catalonia | 0,86026 | 0,5921 | 0,78174 | 0,7447 |
| Valencian Community | 0,82971 | 0,50366 | 0,77941 | 0,70426 |
| Estremadura | 0,7408 | 0,37283 | 0,46829 | 0,52730667 |
| Galicia | 0,48 | 0,29611 | 0,5927 | 0,45627 |
| Madrid's community | 0,59934 | 0,54727 | 0,48024 | 0,54228333 |
| Murcia region | 0,9522 | 0,74399 | 0,87021 | 0,85546667 |
| C. Foral of Navarra | 1,24372 | 1,6987 | 0,76428 | 1,23556667 |
| Basque Country | 0,22788 | 0,27284 | 0,45294 | 0,31788667 |
| The Rioja | 0 | 0,31678 | 0 | 0,10559333 |
| C. A. of Ceuta | 1,17704 | 1,17448 | 4,71826 | 2,35659333 |
| C. A. from Melilla | 0 | 0 | 1,15624 | 0,38541333 |
Table 6, graphic 7: Kill attempts for every 100.000 population
| MURDER ATTEMPTS EVERY 100.000 POPULATION | ||||
| 2017 | 2018 | 2019 | Total mean | |
| Andalusia | 2,47022 | 2,26611 | 1,87777 | 2,2047 |
| Aragon | 1,14613 | 0,61128 | 0,75798 | 0,83846333 |
| Principality of Asturias | 1,06284 | 1,06978 | 1,07548 | 1,06936667 |
| Balearic Islands | 2,50896 | 3,18892 | 3,65389 | 3,11725667 |
| Canary Islands | 1,70768 | 1,92698 | 2,08973 | 1,90813 |
| Cantabria | 0,6893 | 0,51704 | 1,54885 | 0,91839667 |
| Castile and Leon | 0,7008 | 0,95469 | 1,20856 | 0,95468333 |
| Castilla la Mancha | 1,67366 | 1,43082 | 1,47575 | 1,52674333 |
| Catalonia | 1,90581 | 2,21051 | 2,44944 | 2,18858667 |
| Valencian Community | 1,31539 | 1,8736 | 2,17836 | 1,78911667 |
| Estremadura | 1,48159 | 1,21171 | 0,74927 | 1,14752333 |
| Galicia | 0,99692 | 0,92533 | 0,9261 | 0,94945 |
| Madrid's community | 1,32162 | 1,18576 | 1,17057 | 1,22598333 |
| Murcia region | 2,10845 | 1,69089 | 1,67347 | 1,82427 |
| C. Foral of Navarra | 3,26475 | 2,16198 | 1,98712 | 2,47128333 |
| Basque Country | 1,64072 | 1,68252 | 1,22295 | 1,51539667 |
| The Rioja | 1,90246 | 0,63356 | 1,57829 | 1,37143667 |
| C. A. of Ceuta | 8,23927 | 1,17448 | 18,87304 | 9,42893 |
| C. A. from Melilla | 9,28936 | 1,15762 | 9,24995 | 6,56564333 |
Table 7, graphic 8: You fight for every 100.000 population
| FIGHT EVERY 100 000 POPULATION | ||||
| 2017 | 2018 | 2019 | Total mean | |
| Andalusia | 34,96495 | 34,79077 | 41,10888 | 36,9548667 |
| Aragon | 29,79943 | 37,44094 | 41,76486 | 36,3350767 |
| Principality of Asturias | 31,69205 | 36,08093 | 39,30387 | 35,6922833 |
| Balearic Islands | 63,1721 | 70,95352 | 74,20876 | 69,4447933 |
| Canary Islands | 50,18687 | 49,9134 | 53,31132 | 51,1371967 |
| Cantabria | 42,21991 | 47,39508 | 49,04677 | 46,2205867 |
| Castile and Leon | 26,6716 | 29,84438 | 31,29756 | 29,27118 |
| Castilla la Mancha | 28,20605 | 28,71512 | 33,05683 | 29,9926667 |
| Catalonia | 48,78352 | 42,43385 | 43,76423 | 44,9938667 |
| Valencian Community | 37,09393 | 39,60753 | 43,76701 | 40,1561567 |
| Estremadura | 34,72479 | 32,43657 | 29,40873 | 32,19003 |
| Galicia | 31,16301 | 34,86638 | 35,33989 | 33,78976 |
| Madrid's community | 32,64085 | 32,94275 | 36,0477 | 33,8771 |
| Murcia region | 41,08081 | 41,93414 | 49,26709 | 44,0940133 |
| C. Foral of Navarra | 60,32019 | 58,37351 | 61,44778 | 60,04716 |
| Basque Country | 47,80877 | 47,79254 | 52,40568 | 49,3356633 |
| The Rioja | 40,58583 | 45,29975 | 45,45483 | 43,7801367 |
| C. A. of Ceuta | 68,26822 | 59,89852 | 51,90087 | 60,0225367 |
| C. A. from Melilla | 135,85694 | 163,22467 | 168,8115 | 155,96437 |
Table 8, graphic 9: Kidnappings for every 100.000 population
| KIDNAPPING EVERY 100.000 POPULATION | ||||
| 2017 | 2018 | 2019 | Total mean | |
| Andalusia | 0,179 | 0,3101 | 0,36842 | 0,28584 |
| Aragon | 0 | 0 | 0,1516 | 0,05053333 |
| Principality of Asturias | 0 | 0,29176 | 0 | 0,09725333 |
| Balearic Islands | 0 | 0,08858 | 0,52198 | 0,20352 |
| Canary Islands | 0,18974 | 0,094 | 0,04644 | 0,11006 |
| Cantabria | 0 | 0 | 0 | 0 |
| Castile and Leon | 0,08245 | 0,08302 | 0,08335 | 0,08294 |
| Castilla la Mancha | 0,09845 | 0,24669 | 0,04919 | 0,13144333 |
| Catalonia | 0,13235 | 0,06579 | 0,07817 | 0,09210333 |
| Valencian Community | 0,08095 | 0,12088 | 0,09992 | 0,10058333 |
| Estremadura | 0,0926 | 0 | 0,06208667 | |
| Galicia | 0,14769 | 0,07403 | 0,03704 | 0,08625333 |
| Madrid's community | 0,10757 | 0,18242 | 0,24012 | 0,17670333 |
| Murcia region | 0 | 0,20291 | 0,20082 | 0,13457667 |
| C. Foral of Navarra | 0,15546 | 0,46328 | 0,15286 | 0,2572 |
| Basque Country | 0,41018 | 0,22737 | 0,31706 | 0,31820333 |
| The Rioja | 0 | 0 | 0 | 0 |
| C. A. of Ceuta | 1,17704 | 0 | 2,35913 | 1,17872333 |
| C. A. from Melilla | 0 | 0 | 0 | 0 |
Table 9, graphic 10: Penetrating sexual assaults for every 100.000 population
| SEXUAL ASSAULT WITH PEN. EVERY 100.000 POPULATION | ||||
| 2017 | 2018 | 2019 | Total mean | |
| Andalusia | 2,06448 | 2,39731 | 3,10188 | 2,52122333 |
| Aragon | 2,06304 | 2,52153 | 2,04655 | 2,21037333 |
| Principality of Asturias | 1,93244 | 1,6533 | 1,17325 | 1,58633 |
| Balearic Islands | 4,48029 | 6,46643 | 7,74277 | 6,22983 |
| Canary Islands | 3,79485 | 4,13595 | 3,43644 | 3,78908 |
| Cantabria | 1,37861 | 1,37877 | 1,72094 | 1,49277333 |
| Castile and Leon | 1,27793 | 2,15843 | 1,83368 | 1,75668 |
| Castilla la Mancha | 1,67366 | 2,56561 | 1,91848 | 2,05258333 |
| Catalonia | 5,21452 | 6,15784 | 7,25712 | 6,20982667 |
| Valencian Community | 2,42841 | 3,38457 | 3,53733 | 3,11677 |
| Estremadura | 0,92599 | 1,95738 | 1,68585 | 1,52307333 |
| Galicia | 1,62461 | 2,07274 | 3,44508 | 2,38081 |
| Madrid's community | 3,39625 | 3,83091 | 3,64679 | 3,62465 |
| Murcia region | 2,7886 | 3,11124 | 3,28001 | 3,05995 |
| C. Foral of Navarra | 4,50847 | 5,55938 | 4,27995 | 4,7826 |
| Basque Country | 3,46374 | 5,04755 | 5,57122 | 4,69417 |
| The Rioja | 2,21954 | 2,21747 | 2,84093 | 2,42598 |
| C. A. of Ceuta | 5,88519 | 5,8724 | 1,17957 | 4,31238667 |
| C. A. from Melilla | 0 | 2,31524 | 5,78122 | 2,69882 |
Table 10, graphic 11: Non-penetrative sexual assaults for every 100.000 population
| SEXUAL ASSAULT WITHOUT PEN. EVERY 100.000 POPULATION | ||||
| 2017 | 2018 | 2019 | Total mean | |
| Andalusia | 22,56612 | 25,60706 | 26,79981 | 24,9909967 |
| Aragon | 18,87297 | 23,76353 | 23,19428 | 21,9435933 |
| Principality of Asturias | 12,17438 | 18,4781 | 17,69652 | 16,1163333 |
| Balearic Islands | 41,84592 | 45,26498 | 56,89628 | 48,0023933 |
| Canary Islands | 25,85241 | 31,16063 | 38,86896 | 31,9606667 |
| Cantabria | 13,09679 | 16,2005 | 16,69311 | 15,3301333 |
| Castile and Leon | 13,89232 | 16,2297 | 19,33698 | 16,4863333 |
| Castilla la Mancha | 16,5889 | 21,56101 | 23,85798 | 20,6692967 |
| Catalonia | 24,06089 | 28,02608 | 32,23362 | 28,1068633 |
| Valencian Community | 24,85071 | 28,52709 | 31,4363 | 28,2713667 |
| Estremadura | 13,24172 | 17,98925 | 18,35704 | 16,5293367 |
| Galicia | 15,32304 | 17,91436 | 20,11484 | 17,78408 |
| Madrid's community | 23,89667 | 26,83154 | 29,68457 | 26,80426 |
| Murcia region | 23,8051 | 29,28626 | 32,26459 | 28,4519833 |
| C. Foral of Navarra | 31,55928 | 36,29041 | 31,18246 | 33,0107167 |
| Basque Country | 19,32404 | 24,91942 | 24,68548 | 22,9763133 |
| The Rioja | 15,85384 | 17,42298 | 26,19966 | 19,8254933 |
| C. A. of Ceuta | 23,54077 | 52,85164 | 25,95043 | 34,11428 |
| C. A. from Melilla | 33,67394 | 28,94054 | 32,37481 | 31,6630967 |
Table 11, graphic 12: Robberies with violence for each 100.000 population
| THEFT WITH VIOLENCE EVERY 100.000 POPULATION | ||||
| 2017 | 2018 | 2019 | Total mean | |
| Andalusia | 91,50555 | 85,31312 | 87,28061 | 88,0330933 |
| Aragon | 60,97421 | 71,06137 | 80,64938 | 70,8949867 |
| Principality of Asturias | 35,8468 | 34,62213 | 35,97966 | 35,4828633 |
| Balearic Islands | 121,32627 | 109,39775 | 114,40155 | 115,041857 |
| Canary Islands | 68,11753 | 70,26416 | 71,79381 | 70,0585 |
| Cantabria | 36,87779 | 31,02223 | 38,72114 | 35,5403867 |
| Castile and Leon | 29,92826 | 29,4708 | 29,67225 | 29,6904367 |
| Castilla la Mancha | 50,50508 | 48,00654 | 48,25706 | 48,9228933 |
| Catalonia | 272,83568 | 296,12905 | 344,58961 | 304,518113 |
| Valencian Community | 109,1367 | 103,16894 | 99,58493 | 103,963523 |
| Estremadura | 25,65005 | 23,48855 | 29,97068 | 26,36976 |
| Galicia | 39,02761 | 35,42158 | 35,04354 | 36,4975767 |
| Madrid's community | 250,70753 | 220,32268 | 233,90482 | 234,978343 |
| Murcia region | 99,16526 | 97,7336 | 102,28275 | 99,7272033 |
| C. Foral of Navarra | 67,16063 | 39,37896 | 50,59507 | 52,37822 |
| Basque Country | 81,44354 | 81,44285 | 74,41878 | 79,1017233 |
| The Rioja | 32,97599 | 24,70896 | 28,40927 | 28,6980733 |
| C. A. of Ceuta | 154,19202 | 176,17213 | 171,03696 | 167,133703 |
| C. A. from Melilla | 413,37668 | 385,48805 | 431,27869 | 410,047807 |
Table 12, graphic 13: Burglaries in dwellings for each 100.000 population
| THEFT IN HOUSE EVERY 100.000 POPULATION | ||||
| 2017 | 2018 | 2019 | Total mean | |
| Andalusia | 294,97054 | 274,70037 | 266,86902 | 278,846643 |
| Aragon | 195,22445 | 190,87236 | 177,97438 | 188,02373 |
| Principality of Asturias | 167,83257 | 144,71273 | 152,8158 | 155,120367 |
| Balearic Islands | 383,60249 | 361,4112 | 310,66762 | 351,89377 |
| Canary Islands | 253,63819 | 235,56119 | 200,14962 | 229,783 |
| Cantabria | 282,44255 | 271,2722 | 280,16893 | 277,961227 |
| Castile and Leon | 213,70261 | 221,73667 | 198,57907 | 211,33945 |
| Castilla la Mancha | 382,43073 | 365,15564 | 320,97588 | 356,187417 |
| Catalonia | 412,91294 | 453,74612 | 442,89302 | 436,51736 |
| Valencian Community | 436,40515 | 440,11497 | 396,16137 | 424,227163 |
| Estremadura | 202,978 | 187,53559 | 155,56659 | 182,026727 |
| Galicia | 200,78727 | 197,9833 | 195,99933 | 198,256633 |
| Madrid's community | 296,74895 | 293,82438 | 273,95949 | 288,177607 |
| Murcia region | 473,10942 | 457,01447 | 413,95062 | 448,024837 |
| C. Foral of Navarra | 236,15045 | 233,18519 | 231,42275 | 233,58613 |
| Basque Country | 331,06094 | 363,87812 | 369,6933 | 354,877453 |
| The Rioja | 228,92945 | 190,38568 | 174,24352 | 197,852883 |
| C. A. of Ceuta | 97,69418 | 103,35432 | 68,41478 | 89,8210933 |
| C. A. from Melilla | 164,88621 | 155,12132 | 113,31183 | 144,439787 |
Table 13, graphic 14: Burglaries for every 100.000 population
| ROBBERY AT HOME EVERY 100.000 POPULATION | ||||
| 2017 | 2018 | 2019 | Total mean | |
| Andalusia | 206,16195 | 187,37161 | 182,4526 | 191,995387 |
| Aragon | 136,5425 | 133,41198 | 118,92751 | 129,62733 |
| Principality of Asturias | 92,37072 | 84,41576 | 88,87368 | 88,5533867 |
| Balearic Islands | 280,01817 | 269,99543 | 225,75818 | 258,590593 |
| Canary Islands | 154,78239 | 151,90218 | 134,625 | 147,10319 |
| Cantabria | 161,81425 | 167,86476 | 183,96842 | 171,21581 |
| Castile and Leon | 130,01891 | 147,64458 | 123,52326 | 133,728917 |
| Castilla la Mancha | 270,73871 | 271,41213 | 233,56222 | 258,57102 |
| Catalonia | 308,59614 | 339,65499 | 311,69151 | 319,98088 |
| Valencian Community | 342,56742 | 350,92752 | 305,14998 | 332,88164 |
| Estremadura | 119,26809 | 109,33362 | 93,1901 | 107,263937 |
| Galicia | 125,61204 | 124,88234 | 116,28084 | 122,258407 |
| Madrid's community | 193,04818 | 194,47927 | 172,3446 | 186,624017 |
| Murcia region | 396,25294 | 381,60065 | 335,63202 | 371,16187 |
| C. Foral of Navarra | 148,46852 | 152,41972 | 153,77231 | 151,553517 |
| Basque Country | 184,94566 | 206,17638 | 227,28755 | 206,13653 |
| The Rioja | 186,12408 | 146,66983 | 137,94279 | 156,912233 |
| C. A. of Ceuta | 67,09119 | 70,46885 | 49,54174 | 62,36726 |
| C. A. from Melilla | 114,95588 | 105,34358 | 82,09326 | 100,797573 |
Table 14, graphic 15: Thefts for every 100.000 population
| HURTS EACH 100.000 POPULATION | ||||
| 2017 | 2018 | 2019 | Total mean | |
| Andalusia | 1238,04569 | 1112,66055 | 1086,23001 | 1145,64542 |
| Aragon | 840,80229 | 812,16265 | 796,94321 | 816,63605 |
| Principality of Asturias | 701,57301 | 701,09818 | 663,66836 | 688,77985 |
| Balearic Islands | 2614,9665 | 2436,15955 | 2297,42662 | 2449,51756 |
| Canary Islands | 1429,09254 | 1282,00368 | 1214,17914 | 1308,42512 |
| Cantabria | 858,70118 | 802,0971 | 839,9905 | 833,59626 |
| Castile and Leon | 868,57908 | 817,75255 | 801,85935 | 829,396993 |
| Castilla la Mancha | 748,22334 | 712,99339 | 681,64948 | 714,288737 |
| Catalonia | 2298,67533 | 2527,0047 | 2502,23544 | 2442,63849 |
| Valencian Community | 1495,9398 | 1412,21181 | 1359,73503 | 1422,62888 |
| Estremadura | 670,88303 | 616,48132 | 615,24197 | 634,202107 |
| Galicia | 750,27535 | 734,37777 | 699,6113 | 728,08814 |
| Madrid's community | 2402,40633 | 2319,8566 | 2314,39113 | 2345,55135 |
| Murcia region | 1037,9705 | 997,28848 | 1014,05852 | 1016,43917 |
| C. Foral of Navarra | 1177,17658 | 1196,19368 | 1305,53611 | 1226,30212 |
| Basque Country | 1270,32784 | 1335,91743 | 1370,3383 | 1325,52786 |
| The Rioja | 812,66785 | 741,90227 | 764,52503 | 773,031717 |
| C. A. of Ceuta | 953,40105 | 1014,75148 | 970,78217 | 979,6449 |
| C. A. from Melilla | 1339,99071 | 1422,71717 | 1392,11673 | 1384,94154 |
Table 15, graphic 16: Vehicle thefts for each 100.000 population
| VEHICLE SUBSTRACTIONS EACH 100.000 POPULATION | ||||
| 2017 | 2018 | 2019 | Total mean | |
| Andalusia | 104,47718 | 82,70113 | 77,76103 | 88,3131133 |
| Aragon | 29,95224 | 21,92969 | 18,57058 | 23,48417 |
| Principality of Asturias | 38,0691 | 21,20119 | 21,80289 | 27,0243933 |
| Balearic Islands | 153,85318 | 128,26555 | 124,84123 | 135,65332 |
| Canary Islands | 85,24179 | 64,57723 | 59,8127 | 69,87724 |
| Cantabria | 35,67151 | 21,37087 | 23,06059 | 26,70099 |
| Castile and Leon | 27,16628 | 24,3653 | 24,08787 | 25,2064833 |
| Castilla la Mancha | 54,39387 | 33,00758 | 30,94158 | 39,4476767 |
| Catalonia | 117,19427 | 120,97265 | 126,55017 | 121,572363 |
| Valencian Community | 79,28752 | 66,54306 | 64,51137 | 70,1139833 |
| Estremadura | 31,11342 | 15,00658 | 13,48681 | 19,8689367 |
| Galicia | 29,31686 | 21,6897 | 22,37452 | 24,46036 |
| Madrid's community | 164,66416 | 132,43988 | 121,34957 | 139,484537 |
| Murcia region | 87,94285 | 64,72737 | 60,57977 | 71,08333 |
| C. Foral of Navarra | 26,27349 | 26,87035 | 28,12535 | 27,08973 |
| Basque Country | 41,01801 | 42,19931 | 40,31206 | 41,17646 |
| The Rioja | 28,21984 | 25,02574 | 21,46478 | 24,9034533 |
| C. A. of Ceuta | 254,24028 | 291,27126 | 198,16696 | 247,892833 |
| C. A. from Melilla | 131,21226 | 101,87072 | 87,87448 | 106,98582 |
Table 16, graphic 17: Drug trafficking for each 100.000 population
| DRUG TRAFFICKING EVERY 100.000 POPULATION | ||||
| 2017 | 2018 | 2019 | Total mean | |
| Andalusia | 41,43287 | 43,60475 | 51,06819 | 45,3686033 |
| Aragon | 20,63037 | 25,67378 | 26,3778 | 24,2273167 |
| Principality of Asturias | 12,56087 | 13,61545 | 19,94525 | 15,3738567 |
| Balearic Islands | 43,27961 | 45,53073 | 56,2003 | 48,33688 |
| Canary Islands | 28,31906 | 29,28065 | 26,74853 | 28,11608 |
| Cantabria | 10,85655 | 14,99408 | 13,76751 | 13,2060467 |
| Castile and Leon | 13,76865 | 16,93534 | 18,25344 | 16,3191433 |
| Castilla la Mancha | 20,96994 | 21,65968 | 22,62818 | 21,7526 |
| Catalonia | 30,02979 | 32,26288 | 33,94041 | 32,0776933 |
| Valencian Community | 32,21688 | 35,43725 | 39,2704 | 35,64151 |
| Estremadura | 18,61249 | 21,71759 | 27,81654 | 22,71554 |
| Galicia | 13,69843 | 15,98968 | 18,85535 | 16,1811533 |
| Madrid's community | 24,71115 | 29,70472 | 36,42288 | 30,2795833 |
| Murcia region | 19,92827 | 19,41145 | 23,83027 | 21,0566633 |
| C. Foral of Navarra | 20,83223 | 21,61982 | 24,30397 | 22,2520067 |
| Basque Country | 15,13109 | 16,68874 | 19,06896 | 16,96293 |
| The Rioja | 25,36614 | 23,12505 | 32,82849 | 27,10656 |
| C. A. of Ceuta | 267,1877 | 194,96383 | 350,33087 | 270,827467 |
| C. A. from Melilla | 74,31491 | 55,56585 | 72,84332 | 67,5746933 |
Table 17, graphic 18 and 19: Relationship between the aging of the population and crimes for each 100.000 population.
| 2017 | ||
| Crimes | % aging | |
| Andalusia | 997,42 | 96,21 |
| Aragon | 723,55 | 140,25 |
| Principality of Asturias | 619,63 | 209,95 |
| Balearic Islands | 1616,42 | 96 |
| Canary Islands | 1083,417 | 105,73 |
| Cantabria | 751,341 | 146,34 |
| Castile and Leon | 740,72 | 190,36 |
| Castilla la Mancha | 787,67 | 113,83 |
| Catalonia | 1397,21 | 111,87 |
| Valencian Community | 1148,95 | 118,05 |
| Estremadura | 611,41 | 134,81 |
| Galicia | 684,68 | 192,51 |
| Madrid's community | 1464,69 | 103,76 |
| Murcia region | 895,92 | 83,38 |
| C. Foral of Navarra | 964,96 | 116,49 |
| Basque Country | 953,52 | 144,99 |
| The Rioja | 624,4 | 130,9 |
| C. A. of Ceuta | 1325,05 | 51,35 |
| C. A. from Melilla | 1377,14 | 40,02 |
Table 18, graphic 20 and 21: Relationship between the percentage of foreigners and crimes for each 100.000 population.
| 2017 | ||
| Crimes | % foreign | |
| Andalusia | 997,42 | 7,23 |
| Aragon | 723,55 | 10,18 |
| Principality of Asturias | 619,63 | 3,75 |
| Balearic Islands | 1616,42 | 16,75 |
| Canary Islands | 1083,417 | 11,7 |
| Cantabria | 751,341 | 5,07 |
| Castile and Leon | 740,72 | 5,04 |
| Castilla la Mancha | 787,67 | 7,9 |
| Catalonia | 1397,21 | 13,7 |
| Valencian Community | 1148,95 | 12,9 |
| Estremadura | 611,41 | 2,92 |
| Galicia | 684,68 | 3,21 |
| Madrid's community | 1464,69 | 12,22 |
| Murcia region | 895,92 | 12,48 |
| C. Foral of Navarra | 964,96 | 8,49 |
| Basque Country | 953,52 | 6,51 |
| The Rioja | 624,4 | 11,11 |
| C. A. of Ceuta | 1325,05 | 6,64 |
| C. A. from Melilla | 1377,14 | 15,5 |
Table 19, graphic 22 and 23: Relationship between the number of tourists and crimes for each 100.000 population.
| 2017 | ||
| Crimes | tourism | |
| Andalusia | 997,42 | 11.518.262 |
| Aragon | 723,55 | 562.352 |
| Principality of Asturias | 619,63 | 294.129 |
| Balearic Islands | 1616,42 | 13.792.296 |
| Canary Islands | 1083,417 | 14.214.222 |
| Cantabria | 751,341 | 414.489 |
| Castile and Leon | 740,72 | 1.458.546 |
| Castilla la Mancha | 787,67 | 226.221 |
| Catalonia | 1397,21 | 19.118.421 |
| Valencian Community | 1148,95 | 8.925.959 |
| Estremadura | 611,41 | 380.914 |
| Galicia | 684,68 | 1.291.086 |
| Madrid's community | 1464,69 | 6.699.785 |
| Murcia region | 895,92 | 991.209 |
| C. Foral of Navarra | 964,96 | 333.317 |
| Basque Country | 953,52 | 1.514.765 |
| The Rioja | 624,4 | 124.189 |
Table 20, graphic 24 and 25: Relationship between GDP per capita and crime for each 100.000 population.
| 2017 | ||
| Crimes | START € | |
| Andalusia | 997,42 | 18501 |
| Aragon | 723,55 | 27115 |
| Principality of Asturias | 619,63 | 21981 |
| Balearic Islands | 1616,42 | 27134 |
| Canary Islands | 1083,417 | 20457 |
| Cantabria | 751,341 | 22767 |
| Castile and Leon | 740,72 | 23169 |
| Castilla la Mancha | 787,67 | 19632 |
| Catalonia | 1397,21 | 29722 |
| Valencian Community | 1148,95 | 21859 |
| Estremadura | 611,41 | 18170 |
| Galicia | 684,68 | 22411 |
| Madrid's community | 1464,69 | 34041 |
| Murcia region | 895,92 | 20766 |
| C. Foral of Navarra | 964,96 | 30508 |
| Basque Country | 953,52 | 32267 |
| The Rioja | 624,4 | 26528 |
| C. A. of Ceuta | 1325,05 | 19537 |
| C. A. from Melilla | 1377,14 | 17934 |
Table 21, graphic 26 and 27: Relationship between average annual household income and crimes for each 100.000 population.
| 2017 | ||
| Crimes | Rent € | |
| Andalusia | 997,42 | 23699 |
| Aragon | 723,55 | 29098 |
| Principality of Asturias | 619,63 | 27454 |
| Balearic Islands | 1616,42 | 32163 |
| Canary Islands | 1083,417 | 22790 |
| Cantabria | 751,341 | 27024 |
| Castile and Leon | 740,72 | 26113 |
| Castilla la Mancha | 787,67 | 23159 |
| Catalonia | 1397,21 | 31411 |
| Valencian Community | 1148,95 | 24034 |
| Estremadura | 611,41 | 20395 |
| Galicia | 684,68 | 26533 |
| Madrid's community | 1464,69 | 32451 |
| Murcia region | 895,92 | 23574 |
| C. Foral of Navarra | 964,96 | 33431 |
| Basque Country | 953,52 | 34203 |
| The Rioja | 624,4 | 28775 |
| C. A. of Ceuta | 1325,05 | 29117 |
| C. A. from Melilla | 1377,14 | 34089 |
Table 22, graphic 28 and 29: Relationship between the at-risk-of-poverty rate and crimes for each 100.000 population.
| 2017 | ||
| Crimes | Poverty laughter rate | |
| Andalusia | 997,42 | 31 |
| Aragon | 723,55 | 13,3 |
| Principality of Asturias | 619,63 | 12,6 |
| Balearic Islands | 1616,42 | 21,3 |
| Canary Islands | 1083,417 | 30,5 |
| Cantabria | 751,341 | 17,6 |
| Castile and Leon | 740,72 | 15,4 |
| Castilla la Mancha | 787,67 | 28,1 |
| Catalonia | 1397,21 | 15 |
| Valencian Community | 1148,95 | 25,6 |
| Estremadura | 611,41 | 38,8 |
| Galicia | 684,68 | 18,7 |
| Madrid's community | 1464,69 | 16,9 |
| Murcia region | 895,92 | 30,1 |
| C. Foral of Navarra | 964,96 | 8,3 |
| Basque Country | 953,52 | 9,7 |
| The Rioja | 624,4 | 9,7 |
| C. A. of Ceuta | 1325,05 | 32,5 |
| C. A. from Melilla | 1377,14 | 26,2 |
Table 23, graphic 30 and 31: Relationship between the unemployment rate and crimes for each 100.000 population.
| 2017 | ||
| Crimes | Unemployment rate | |
| Andalusia | 997,42 | 23,8 |
| Aragon | 723,55 | 10,5 |
| Principality of Asturias | 619,63 | 12,8 |
| Balearic Islands | 1616,42 | 11,2 |
| Canary Islands | 1083,417 | 22 |
| Cantabria | 751,341 | 12,5 |
| Castile and Leon | 740,72 | 13 |
| Castilla la Mancha | 787,67 | 19 |
| Catalonia | 1397,21 | 12,1 |
| Valencian Community | 1148,95 | 16,4 |
| Estremadura | 611,41 | 24,6 |
| Galicia | 684,68 | 14,9 |
| Madrid's community | 1464,69 | 12,1 |
| Murcia region | 895,92 | 16,4 |
| C. Foral of Navarra | 964,96 | 8,8 |
| Basque Country | 953,52 | 10,5 |
| The Rioja | 624,4 | 11 |
| C. A. of Ceuta | 1325,05 | 22,3 |
| C. A. from Melilla | 1377,14 | 22,3 |
Table 24, graphic 32, 33, 34 and 35: Relationship between the educational level of the population and crimes for each 100.000 population.
| 2017 | ||||
| Crimes | % up to 1st secondary stage | % up to 2nd secondary stage | % higher education | |
| Andalusia | 997,42 | 51 | 18,9 | 30,1 |
| Aragon | 723,55 | 35,2 | 24,9 | 39,9 |
| Principality of Asturias | 619,63 | 34,4 | 23,1 | 42,7 |
| Balearic Islands | 1616,42 | 42,7 | 25,4 | 31,8 |
| Canary Islands | 1083,417 | 46,9 | 22,7 | 30,4 |
| Cantabria | 751,341 | 33,7 | 24,7 | 41,6 |
| Castile and Leon | 740,72 | 40,1 | 23,4 | 36,5 |
| Castilla la Mancha | 787,67 | 50,9 | 19,9 | 29,2 |
| Catalonia | 1397,21 | 36,9 | 21,6 | 41,5 |
| Valencian Community | 1148,95 | 44,4 | 21,4 | 34,2 |
| Estremadura | 611,41 | 57 | 16,3 | 26,6 |
| Galicia | 684,68 | 41,9 | 20,9 | 37,3 |
| Madrid's community | 1464,69 | 26,5 | 23,7 | 49,8 |
| Murcia region | 895,92 | 45,2 | 21,5 | 33,3 |
| C. Foral of Navarra | 964,96 | 30,3 | 22,2 | 47,5 |
| Basque Country | 953,52 | 27,6 | 20,5 | 51,9 |
| The Rioja | 624,4 | 37,6 | 21,8 | 40,7 |
| C. A. of Ceuta | 1325,05 | 46,8 | 24 | 29,2 |
| C. A. from Melilla | 1377,14 | 46,8 | 24 | 29,2 |
Table 25, graphic 36 and 37: Relationship between early school leaving and crimes for each 100.000 population.
| 2017 | ||
| Crimes | % abandonment | |
| Andalusia | 997,42 | 23,5 |
| Aragon | 723,55 | 16,4 |
| Principality of Asturias | 619,63 | 14,8 |
| Balearic Islands | 1616,42 | 26,5 |
| Canary Islands | 1083,417 | 17,5 |
| Cantabria | 751,341 | 8,9 |
| Castile and Leon | 740,72 | 16,7 |
| Castilla la Mancha | 787,67 | 22,1 |
| Catalonia | 1397,21 | 17 |
| Valencian Community | 1148,95 | 20,3 |
| Estremadura | 611,41 | 19,2 |
| Galicia | 684,68 | 14,9 |
| Madrid's community | 1464,69 | 13,9 |
| Murcia region | 895,92 | 23,1 |
| C. Foral of Navarra | 964,96 | 11,3 |
| Basque Country | 953,52 | 7 |
| The Rioja | 624,4 | 12,9 |
| C. A. of Ceuta | 1325,05 | 20,1 |
| C. A. from Melilla | 1377,14 | 27,5 |
Table 26, graphic 38 and 39: Relationship between spending on education for each 100.000 inhabitants and crimes for each 100.000 population.
| 2017 | ||
| Crimes | Education expenditure | |
| Andalusia | 997,42 | 96538386,27 |
| Aragon | 723,55 | 95346475,64 |
| Principality of Asturias | 619,63 | 84092621,95 |
| Balearic Islands | 1616,42 | 86575973,72 |
| Canary Islands | 1083,417 | 87356608,09 |
| Cantabria | 751,341 | 104525457 |
| Castile and Leon | 740,72 | 91089994,62 |
| Castilla la Mancha | 787,67 | 85290716,79 |
| Catalonia | 1397,21 | 90591040,3 |
| Valencian Community | 1148,95 | 94015714,63 |
| Estremadura | 611,41 | 101243795,9 |
| Galicia | 684,68 | 94208516,75 |
| Madrid's community | 1464,69 | 76593100,8 |
| Murcia region | 895,92 | 97017628,75 |
| C. Foral of Navarra | 964,96 | 108324187 |
| Basque Country | 953,52 | 133043199,3 |
| The Rioja | 624,4 | 92087031,24 |
| C. A. of Ceuta | 1325,05 | 10027189,82 |
| C. A. from Melilla | 1377,14 | 17698560,61 |
Table 27, graphic 40 and 41: Relationship between spending on culture for each 100.000 inhabitants and crimes for each 100.000 population.
| 2017 | ||
| Crimes | Culture expenditure | |
| Andalusia | 997,42 | 2056153,95 |
| Aragon | 723,55 | 1468958,93 |
| Principality of Asturias | 619,63 | 2153030,07 |
| Balearic Islands | 1616,42 | 1832259,71 |
| Canary Islands | 1083,417 | 1026364,24 |
| Cantabria | 751,341 | 3022600,57 |
| Castile and Leon | 740,72 | 2639087,05 |
| Castilla la Mancha | 787,67 | 1381555,01 |
| Catalonia | 1397,21 | 3665752,14 |
| Valencian Community | 1148,95 | 1906057,44 |
| Estremadura | 611,41 | 3245981,18 |
| Galicia | 684,68 | 2776904,96 |
| Madrid's community | 1464,69 | 1437165,45 |
| Murcia region | 895,92 | 1799597,76 |
| C. Foral of Navarra | 964,96 | 6307036,01 |
| Basque Country | 953,52 | 5157878,33 |
| The Rioja | 624,4 | 2991936,74 |
| C. A. of Ceuta | 1325,05 | 4398592,26 |
| C. A. from Melilla | 1377,14 | 11575708,3 |
Table 28, graphic 42 and 43: Relationship between social work units for each 100.000 inhabitants and crimes for each 100.000 population.
| 2017 | ||
| Crimes | UTS | |
| Andalusia | 997,42 | 10,6565535 |
| Aragon | 723,55 | 2,97994269 |
| Principality of Asturias | 619,63 | 11,0149185 |
| Balearic Islands | 1616,42 | 0,98566397 |
| Canary Islands | 1083,417 | 5,92945092 |
| Cantabria | 751,341 | 20,5068112 |
| Castile and Leon | 740,72 | 16,7779632 |
| Castilla la Mancha | 787,67 | 22,3974749 |
| Catalonia | 1397,21 | 8,35116724 |
| Valencian Community | 1148,95 | 6,61741181 |
| Estremadura | 611,41 | 7,03755834 |
| Galicia | 684,68 | 15,3968909 |
| Madrid's community | 1464,69 | 1,55213069 |
| Murcia region | 895,92 | 9,86211404 |
| The Rioja | 624,4 | 30,1222965 |
| C. A. of Ceuta | 1325,05 | 1,17703834 |
| C.A from Melilla | 1377,14 | 3,48351138 |
- Web page: https://entredatos.es/mapa/crimen/espana/ ↑
- Annexed: Table 1, graphic 1 and 2: Average of crimes for each 100.000 population ↑
- Annexed: Table 1, graphic 1 and 2: Average of crimes for each 100.000 population. ↑
- Annexed: Table 2, graphic 3: Crimes for each 100.000 inhabitants and by quarters of 2017.: Table 3, graphic 4: Crimes for each 100.000 inhabitants and by quarters of 2018.: Table 4, graphic 5: Crimes for each 100.000 inhabitants and by quarters of 2019. ↑
- Annexed: Table 5, graphic 6: Murders for every 100.000 population ↑
- Annexed: Table 6, graphic 7: You fight for every 100.000 population. ↑
- Annexed: Table 7, graphic 8: You fight for every 100.000 population. ↑
- Annexed: Table 7, graphic 9: Kidnappings for every 100.000 population. ↑
- Annexed: Table 9, graphic 10: Penetrating sexual assaults for every 100.000 population. ↑
- Annexed: Table 10, graphic 11: Non-penetrative sexual assaults for every 100.000 population. ↑
- Annexed: Table 11, graphic 12: Robberies with violence for each 100.000 population. ↑
- Annexed: Table 12, graphic 13: Burglaries in dwellings for each 100.000 population. ↑
- Annexed: Table 13, graphic 14: Burglaries for every 100.000 population. ↑
- Table 14, graphic 15: Thefts for every 100.000 population. ↑
- Annexed: Table 15, graphic 16: Vehicle thefts for each 100.000 population. ↑
- Table 16, graphic 17: Drug trafficking for each 100.000 population. ↑
- Annexed: Table 17, graphic 18 and 19: Relationship between the aging of the population and crimes for each 100.000 population. ↑
- Annexed: Table 18, graphic 20 and 21: Relationship between the percentage of foreigners and crimes for each 100.000 population. ↑
- Annexed: Table 19, graphic 22 and 23: Relationship between the number of tourists and crimes for each 100.000 population. ↑
- Annexed: Table 20, graphic 24 and 25: Relationship between GDP per capita and crime for each 100.000 population. ↑
- Annexed: Table 21, graphic 26 and 27: Relationship between the average annual income per household and the crimes for each 100.000 population. ↑
- Annexed: Table 22, graphic 28 and 29: Relationship between the at-risk-of-poverty rate and crimes for each 100.000 population. ↑
- Annexed: Table 23, graphic 30 and 31: Relationship between the unemployment rate and crimes for each 100.000 population. ↑
- Annexed: Table 24, graphic 32, 33, 34 and 35: Relationship between the unemployment rate and crimes for each 100.000 population. ↑
- Annexed: Table 25, graphic 36 and 37: Relationship between early school leaving and crimes for each 100.000 population. ↑
- Annexed: Table 26, graphic 38 and 39: Relationship between public spending on education and crimes for each 100.000 population. ↑
- Annexed: Table 27, graphic 40 and 41: Relationship between public spending on education and crimes for each 100.000 population. ↑
- Annexed: Table 28, graphic 42 and 43: Relationship between public spending on education and crimes for each 100.000 population. ↑
- Statistics National Institute: National results of adults convicted of crime according to age, 2017. ↑
- Educational quality was evaluated according to the PISA report, a global education evaluation system. ↑