
A while ago a friend who was studying criminology @Andriana he raised an idea he had for his TFG (Final degree project). This consisted of the analysis of a crime map of Spain.
Since it seemed like a very good idea and there is nothing similar in Spain (as a good student of Data science at the Polytechnic University of Valencia) I got down to work.


——-SKIP THIS PART IF YOU GET THE PART OF DATA SCIENCE—-
The first phase of the project was the obtaining the data, which was quite complicated since the datasets provided by the Ministry of the Interior on crimes do not have relevant data such as the population of each municipality or the coordinates where these are found. Thus, it was necessary to search different databases and even collect data on your own.
The data sources obtained were:
- Data from the Ministry of the Interior of crimes by typology of municipalities of more than 30.000 population
- INE data from the population census of all the municipalities of Spain of different years
- Coordinate data of the municipalities present in the crime dataset by typology. These were collected using a python script that automates the coordinate collection process with the library Selenium. This script was self-made.
The second level of the project was the data integration, in which the three different data sources were put together. For it, the library was used difflib Python since the names of the municipalities vary in the three different datasets and it was necessary to find the most similar names in the three different datasets.
For example:
Dataset1 = Valencia
Dataset2 = Valencia Valencia
Dataset3 = Valencia
A way to see which were the most similar names was needed to integrate the three datasets. And for this the library was used difflib in a self-made script.
The third and last phase of the project was the preparation of the crime map in Spain and customizing it to make it as simple as possible.
At first this map was made in R using Shiny and leaflet, However, the little customization that these libraries allowed made a new version necessary.
This new version was made in typescript using React and leaflet in the frontend and javascript with Express and el backend.
——–END OF PART OF DATA SCIENCE——————————————-
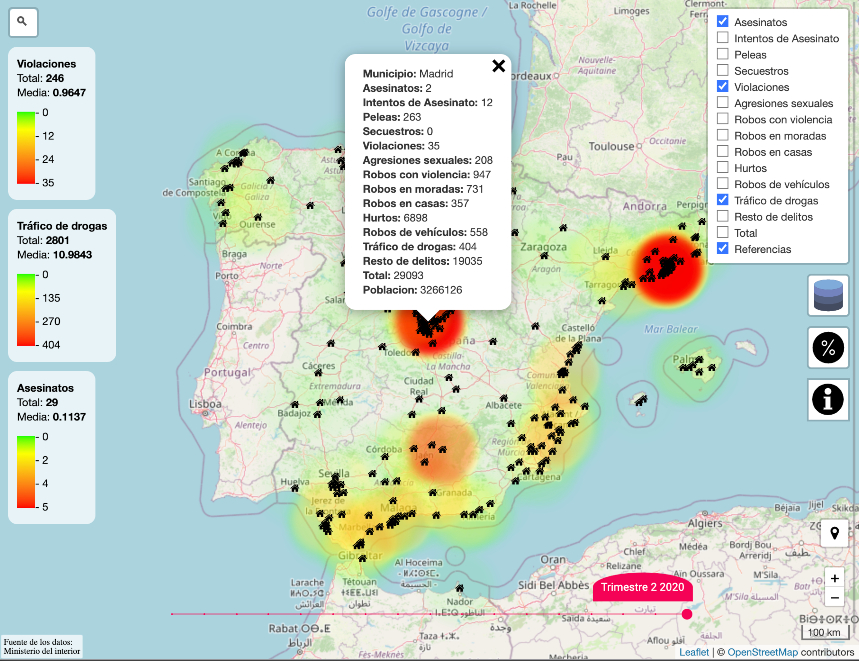
He crime map in Spain is a heat map showing the number of crimes committed every four quarters in more of 240 municipalities of Spain.
This helps identify at a glance the territories and quarters with the highest and lowest criminal activity, as well as some of the most and less common typologies.
You can also filter display to choose the criminal typology what do you want to observe, he display granule (municipality, province or autonomous community) O well, the relativity of crimes (absolute amounts or every 100.000 population)
I wanted to thank @Andriana for having shared your idea with me. Thanks to her I have learned many technologies, libraries and programming languages that I did not know.
In addition to that we have developed a tool that allows you to see the crime of Spain according to the type of crime, what in the not too distant future, will allow the implementation of new policies that make the most problematic places safer.